Abstract
Validation study for two companion papers — the Concept Allocation Zone (CAZ) framework [Henry, 2026a] and the Geometric Evolution Maps (GEM) extraction method [Henry, 2026b]. We test both, unchanged, across a broad corpus of base transformer language models and a wide set of semantic concepts.
The central result is that the structures CAZ and GEM detect are geometrically causal, not descriptive artifacts, though none of the framework’s seven pre-registered predictions is confirmed outright. Ablating the concept directions they identify suppresses concept separation in the residual stream; activation patching at the same sites recovers concept encoding downstream. The effect is direction-specific — it does not appear under random-direction controls — and holds across architectures and across the full range of detection confidence, from the most geometrically prominent structures to the faintest ones a naive threshold would miss. Yet no single fixed layer — short of the model’s own final one — reliably captures that causal structure, whether for reading a concept off it or for intervening on it: it is a trajectory tracked across depth, not a coordinate read off at one chosen point.
1. Introduction
A common assumption in mechanistic interpretability is that a concept’s representation can be read off at a single, well-chosen layer — the residual-stream depth where a linear probe or difference-of-means direction achieves maximum separation. Two companion frameworks question that assumption from different angles: the Concept Allocation Zone (CAZ) framework [Henry, 2026a] tracks how a concept assembles across depth rather than asking where it lives, and the Geometric Evolution Maps (GEM) method [Henry, 2026b] tracks how the concept’s direction rotates during that assembly and extracts it only once the rotation has settled, rather than reading it off at a fixed layer.
Scope at a glance. The framework paper [Henry, 2026a] evaluates its pre-registered predictions at C = 7 concepts on a 35-model corpus (29 base + 6 instruct); the GEM paper [Henry, 2026b] works at C = 17 on 29 base models; this paper evaluates all seven predictions at C = 17, N = 250, on its 28-base-model roster (Table 1). The full coverage-and-rationale table is in [Henry, 2026a] §1.
The CAZ Framework paper [Henry, 2026a] introduced the framework and its definitions — separation, coherence, velocity, allocation zones — and reported preliminary results across 35 models and 8 architecture families, including instruct-tuned variants. The companion GEM paper [Henry, 2026b] introduced Geometric Evolution Maps — the settled direction and handoff layer GEM tracks within each CAZ segment — and reported its own preliminary results across 29 base models. This paper is a systematic evaluation of CAZ’s predictions and GEM’s causal claims by the same research group. We isolate the base models and stress-test both across 28 base models from those same 8 families, characterize phenomena that neither framework anticipated (multimodal allocation, encoding strategy divergence, gentle CAZes), and quantify the limits of our seventeen-concept probe set.
A central positive finding is that both frameworks’ detected structures are geometrically causal, in the ablation-measured sense of the §6 scope note: CAZ peaks are ablation-sensitive and direction-specific across architectures (§6.1), and GEM handoff ablation is predictive (§6.5). One measurement qualifies CAZ’s peak-level prediction — the geometrically dominant CAZ peak is not the region whose single-direction ablation most reduces separation in 50.3% of multimodal cases (§6.4). Geometric prominence — widely used as a proxy for functional importance in probing and ablation studies [Belinkov, 2022; Tenney et al., 2019] — is, on this evidence, reliable for identifying causally-active candidate layers but not for ranking among them; what the divergence between them reflects is a mechanistic question left to dedicated follow-up (§6.4).
GEM handoff ablation is comparable in the MHA (0.588 mean separation reduction) and GQA (0.625) cohorts — both strongly causally active — while Gemma-2 (an n=2 case study; §8.3) is a measured exception whose geometric readout is unreliable: its concept is fully recoverable by held-out probing but distributed across many dimensions, so a weak single-direction ablation there is a sample-starved point estimate, not absent concept encoding — an estimator limitation, not a generalised architectural finding (§6.9).
The behavioral pilot confirms these directions are functionally direction-specific on next-token predictions (27/28 models; random-direction ablation ≈ 0) while leaving peak-vs-matched-control advantage unresolved at its probe count (§6.8).
1.1 Contributions
- A cross-architecture concept allocation study spanning 28 base models (37 including instruct-tuned variants), 8 architecture families, 17 semantic concepts, 1,045 detected CAZ regions, and 476 model–concept pairs
- A statistically robust but moderate-strength concept ordering tendency across architectures (median per-model \(\tau = 0.404\), moderate rank correlation; Wilcoxon W = 0 (sum-of-positive-ranks = 378 over 27 non-zero models), p = 1.49×10⁻⁸; 27 of 28 models positively correlated, with GPT-2-medium at exactly zero — sign consistency, not magnitude), positive in every architecture family (§3.2)
- A scored detection method that recovers 1.88× more structure than threshold detection (555 threshold vs 1,045 scored for 28 × 17). A permutation null model (a 5-model × 7-concept subset — the 10 later concepts have no null coverage) confirms that peak separation is 2–10× above noise (p < 0.01, 35/35 real concepts; sham concept non-significant, 0/5) while peak count is not diagnostic — ablation in §6.1 independently confirms the newly visible structure is suppression-sensitive (ablation-measured reduction, not behavioral impact)
- Causally-active CAZ peaks across attention architectures: the MHA and GQA+SwiGLU cohorts are comparable on ablation (both strongly causally active at C=17, ablation-measured), with Gemma-2’s final-global-layer localization the one architecture-specific exception (an n=2 case study; §6.4, §8.3)
- A prediction scorecard for the framework’s 7 predictions: none confirmed outright, 3 partially supported (P1, P2, P3), 1 not testable as stated (P4), 1 not supported (P6), and 1 indeterminate (P7, underpowered scale test); the seventh (P5: cross-architecture depth-stratified convergence) is evaluated in dedicated companion work [Henry, 2026d, in preparation], not scored here — with each failure or partial result generating informative new directions (§5.8)
- ~91.4% of the 700 persistent spectral features remain unlabeled by our probes (60 of 700 labeled, N=250, all 28 models; an unweighted feature count, not a variance-weighted fraction)
2. Methods
2.1 Models
We evaluate 28 base transformer language models from 8 architecture families:
| Family | Models | Scale Range | Layers | Pos. Enc. | Attention | Activation |
|---|---|---|---|---|---|---|
| Pythia | 8 | 70M–12B | 6–36 | Rotary | MHA | GELU |
| GPT-2 | 4 | 124M–1.5B | 12–48 | Learned | MHA | GELU |
| OPT | 5 | 125M–6.7B | 12–32 | Learned | MHA | ReLU |
| Qwen 2.5 | 5 | 0.5B–14B | 24–48 | Rotary | GQA | SwiGLU |
| Gemma 2 | 2 | 2B–9B | 26–42 | Rotary | GQA (alt. local/global SW) | GeGLU |
| Llama 3.2 | 2 | 1B–3B | 16–28 | Rotary | GQA | SwiGLU |
| Mistral | 1 | 7B | 32 | Rotary | GQA | SwiGLU |
| Phi | 1 | 2.7B | 32 | Rotary | MHA | GELU |
Table 1: Model inventory. MHA = multi-head attention. GQA =
grouped-query attention. SW = sliding window. The MHA cohort spans both
GELU (GPT-2, Pythia, Phi-2) and ReLU (OPT) activations; we therefore
label this cohort by attention mechanism (“MHA”), not activation,
throughout. Gemma-2 uses alternating local/global attention (a GQA
variant, its local layers windowed — SW) and is analyzed as a separate
cohort; Mistral-7B-v0.3 uses full (non-windowed) attention — the
sliding-window attention of Mistral-7B-v0.1 was removed at v0.2
(sliding_window: null) — so it is a plain GQA+SwiGLU model
here. All models run in bfloat16 on 2× NVIDIA L4 (22 GiB each);
Gemma-2-9b fits via device-mapped sharding across both GPUs.
Architecture papers: Pythia [Biderman et al., 2023], GPT-2 [Radford et
al., 2019], OPT [Zhang et al., 2022], Qwen 2.5 [Qwen Team, 2024], Gemma
2 [Gemma Team, 2024], Llama 3.2 [Meta, 2024], Mistral [Jiang et al.,
2023], Phi-2 [Javaheripi et al., 2023].
Analysis coverage. pythia-12b and Qwen2.5-14B are the two largest models, added to extend the scale range. All primary results and the main ablation controls are computed over the full 28: peak-depth ordering and Kendall-\(\tau\) statistics (§3.1–3.2), CAZ detection counts (§2.4), multimodal rates (§4.2), the GEM handoff-ablation and patching cohort table (§6.4, Table 9), and the global-sweep peak-vs-peak-distal enrichment with its model-level cluster bootstrap (§6.1, Table 8). The four originally data-limited analyses — the §6.2 dependency structure (multi-zone ablation), the §6.4 peak-vs-functional divergence rate (per-CAZ multimodal ablation), the §6.8 direction-specificity and behavioral pilots (Table 11), and the §7 dark-matter eigendecomposition census (persistent-feature count) — have since been re-run on the two larger models and are reported at 28 throughout. The §7 concept-labeled fraction of persistent features is now also at 28 models, and additionally at the full C=17 concept set rather than the original C=7 (60/700, ~8.6%; see §7 for the labeling-criterion note). The §4.5 cross-concept shallow-sharing cosines (Table 5) have also been migrated to 28 (exact reproduction of the 26-model figures confirmed the methodology before extending); that analysis remains scoped to the original C=7 concept pairs and was not extended to the 10 later concepts.
These span learned position embeddings (GPT-2, OPT), rotary (all others); multi-head and grouped-query attention; sliding-window attention (Gemma-2’s local layers); SwiGLU, GeGLU (Gemma-2), ReLU (OPT), and GELU activations; and training corpora ranging from The Pile to proprietary multilingual data to synthetic textbooks (Phi-2).
Nine instruct-tuned variants (4 Qwen 2.5, 2 Llama-3.2, 1 Mistral-7B, 2 Gemma-2) were also extracted and are profiled in Supplementary §B; analysis of alignment training effects is reserved for future work.
2.2 Concepts and Datasets
Concepts. Seventeen semantic concepts spanning six categories:
| Category | Concepts |
|---|---|
| Syntactic/Morphological | negation, specificity, plurality |
| Relational | causation, temporal_order, agency |
| Register | formality |
| Epistemic | credibility, certainty |
| Affective | sentiment, moral_valence, sarcasm |
| Behavioral | threat_severity, authorization, urgency, deception, exfiltration |
The seven original concepts are grounded in established NLP literature (negation [Morante & Blanco, 2012]; sentiment [Socher et al., 2013]; certainty/epistemic modality [Szarvas et al., 2012]; causation [Mirza & Tonelli, 2016]; temporal ordering [Pustejovsky et al., 2003; UzZaman et al., 2013]; moral valence [Haidt & Joseph, 2004]; credibility, as argument quality in user-generated discourse [Habernal & Gurevych, 2017]); the ten additional concepts extend coverage into morphosyntax, pragmatics, and behavioral/safety semantics. All 17 were selected for definitional clarity and contrastive operationalizability.
A domain-specificity caveat applies to the behavioral-safety subset (threat_severity, authorization, urgency, deception, exfiltration): these are narrower technical terms whose training distribution is concentrated in security- and policy-domain text — exfiltration especially, a cybersecurity term rarely encountered elsewhere, whose deepest-of-17 placement (81.0%, Table 3) is as consistent with a memorized domain representation as a compositional one. Depth figures for this subset should be read cautiously relative to the general-domain concepts.
Datasets. Each concept is operationalized via 250 contrastive text pairs from the Rosetta Concept Pairs (RCP) consensus corpus (https://github.com/jamesrahenry/Rosetta_Concept_Pairs; DOI: https://doi.org/10.5281/zenodo.20059650) — a multi-generator pool built to defuse single-generator bias by construction (per concept, 100 topics independently prompted to 14 generators across four AI labs, ~1,400 pairs, from which 250 are drawn stratified across generators). The construction detail and the three single-generator risks it mitigates, the cross-architecture survival test (all 250 pairs per concept clear a 6-model MHA+GQA gauntlet, 100% survival), and the head-to-head comparison against the earlier single-generator corpus (category ordering preserved; per-cell depths corpus-sensitive, median |Δ| ≈ 9.4 pp — §C) are in supplementary §K.
Pair-level audits. Three pair-level audits accompany the corpus (full protocol, scripts, and per-rater detail in supplementary §K).
(a) Lexical-separability ceiling. A bag-of-words baseline classifies every concept essentially perfectly (held-out AUC 0.999) — the pairs are lexically separable by construction, so this ceiling cannot discriminate the ordering; an off-ceiling redesign finds that surface lexical difficulty does not reproduce the depth ordering (Kendall τ spans 0.18–0.38 across seven pre-specified difficulty measures vs the corpus 0.404; six are non-significant at n = 17, and the one exception — a character 2–3-gram/(1−AUC) measure at τ = 0.382, p = 0.034 — does not survive correction for the seven measures tried, 0.034 × 7 = 0.24).
(b) Lexical overlap. Pair-level lexical overlap is modest (mean Jaccard 0.154).
(c) Human validation of pair fidelity — first pass complete. A 31-rater crowd study (540 analysis-grade ratings over 180 pairs) finds 119 pairs (66%) clean and 14 of 17 concepts ≥76% valid, but a systematic, diagnostic defect: the negatives are frequently opposite-pole (antonym) rather than concept-absent — negative-side failures outnumber positive-side 2.7 : 1, with moral_valence categorically weak (no clean pair of ten; its negatives morally bad rather than neutral, so an antonym negative still activates the concept direction). This does not affect the aggregate ordering finding; its geometric reading — a bad pair still solidifies a real, stable direction, just the wrong axis — is developed in §8.8, and moral_valence plus the 20 defective pairs are slated for regeneration under a corrected presence-versus-absence template (a corpus-level fix shared with the companion papers [Henry, 2026a; Henry, 2026b; Henry, 2026d]). Full protocol, per-rater screening, and reliability analysis accompany the corpus.
2.3 Metrics
We use three layer-wise metrics defined in [Henry, 2026a]:
Separation \(S_c(\ell)\): Fisher-normalized [Fisher, 1936] centroid distance in the residual stream, computed as
\[S_c(\ell) = \frac{\|\mu^+_\ell - \mu^-_\ell\|_2}{\sqrt{\tfrac{1}{2}\!\left(\operatorname{tr}(\Sigma^+_\ell) + \operatorname{tr}(\Sigma^-_\ell)\right)}}\]
where \(\mu^\pm_\ell\) are class centroids and \(\operatorname{tr}(\Sigma^\pm_\ell) = \sum_j \operatorname{Var}_j\) is the sum of per-dimension unbiased variances (i.e., the total within-class spread). The denominator is the square root of the average within-class total variance — a trace-based approximation that normalizes for layer-wise variation in activation scale without requiring matrix inversion. This is numerically stable for any \(n, d\) since no matrix inverse is computed; the full Mahalanobis form (\(\Sigma^{-1}\) in the numerator) would be rank-deficient at \(d > n\) and is not used. Fisher normalization is critical: it accounts for varying activation scale across layers and models, enabling direct comparison.
Coherence \(C_c(\ell)\): Fraction of concept-related variance captured by the top principal component. High coherence = concentrated, low-dimensional representation.
Velocity \(v_c(\ell) = dS_c/d\ell\): Layer-wise rate of separation change, smoothed with an adaptive window \(k = \max(1, \lfloor L/24 \rfloor)\) where \(L\) is the model’s layer count. The constant 24 is calibrated to GPT-2-medium (the initial development model), giving \(k = 1\) at that depth and scaling proportionally for deeper architectures; it has not been formally validated against ground-truth concept boundaries. The window actually used to generate the released artifacts and Figure 3 differs from this description; the discrepancy affects no reported count, since the scored detector never reads velocity (below) — full detail in supplementary §A. Smoothing sensitivity: the velocity peak count is strongly window-dependent — fixed-window alternatives (k ∈ {12, 24, 48} constant across all architectures) yield 548–1,032 velocity peaks across the 476 model-concept pairs at the 0.5% prominence floor, versus 3,247 at adaptive k (a 3.1–5.9× reduction), because the adaptive rule gives a narrow window (\(k = 1\)–2 at the depths sampled here) while the fixed alternatives smooth far more aggressively. The adaptive choice is deliberate: deeper models produce smoother velocity curves, and scaling the window with depth keeps the effective smoothing comparable across architectures. This window-dependence does not propagate to any count reported in this paper. The scored detector (§2.4), which produces every CAZ region count, multimodal rate, and regions-per-pair figure reported here, takes the separation series as its only input — velocity is carried alongside it but is never read. Re-running detection with velocity recomputed at k ∈ {adaptive, 12, 24, 48} returns identical results at every setting (1,045 regions, 76.3% multimodal, 2.20 regions/pair), so the multimodality results of §4.2 are invariant to the smoothing window rather than contingent on it (the §6.4 divergence rate is measured over the per-CAZ ablation population, a downstream subset — §6.4). Velocity is used in this paper only as a descriptive and boundary-visualization quantity; neither the scored detector (§2.4) nor the threshold detector reads it.
Adjacent-layer CKA \(\text{CKA}(\ell, \ell{+}1)\): Linear Centered Kernel Alignment [Kornblith et al., 2019] between the residual stream at consecutive layers. For layer activations \(X \in \mathbb{R}^{n \times d}\), the linear kernel is \(K = XX^\top\), and
\[\text{CKA}(K_\ell, K_{\ell+1}) = \frac{\text{HSIC}(K_\ell, K_{\ell+1})}{\sqrt{\text{HSIC}(K_\ell, K_\ell) \cdot \text{HSIC}(K_{\ell+1}, K_{\ell+1})}}\]
using the unbiased HSIC estimator. Values near 1 indicate representational stability (little transformation between layers); dips mark active transformation windows. Used in §6.7 to refine CAZ extent and characterize peak-distal coasting regions.
2.4 Detection Methods
Threshold: CAZ boundaries from the same scored separation-curve detector described below, run at a stricter 10% prominence floor. Detects 555 CAZes across 28 models × 17 concepts.
Scored (primary): A composite score incorporating three features:
\[\text{CAZ score} = \text{prominence} \times \text{coherence boost} \times \sqrt{\text{width}/L}\]
where prominence is the peak’s topographic prominence normalised by
the model’s global mean separation, \(\text{coherence boost} = 1 + C_\text{peak} /
\bar{C}_\text{model}\) (peak coherence at the detected peak
divided by mean coherence across all layers for that model, so a peak
with above-average coherence scores >2× its prominence), and width is
the number of layers in the CAZ region normalised by the model’s layer
count \(L\), computed via the CAZ
scorer with a 0.5% prominence floor. This detects 1,045 CAZ regions
across 28 models × 17 concepts (476 model–concept pairs) — a 1.88×
increase over threshold. The scored detector has two further fixed
parameters that affect region counts: a peak-merge threshold
min_valley_depth_frac = 0.03 (adjacent peaks whose
separating valley is shallower than 3% of the global peak separation
merge into a single region) and a minimum peak separation
min_peak_distance = 2 layers. Both are held fixed at these
values throughout; their sensitivity is not swept here and is noted as a
researcher degree of freedom in §8.7. We categorize CAZes by score:
| Category | Score Range | Count | % of Total |
|---|---|---|---|
| Major CAZ | > 0.5 | 254 | 24.3% |
| Strong | 0.2–0.5 | 284 | 27.2% |
| Moderate | 0.05–0.2 | 346 | 33.1% |
| Gentle | < 0.05 | 161 | 15.4% |
Table 2: Score distribution of 1,045 detected CAZ regions across
28 models × 17 concepts, computed directly from
load_scored_region_df against the Table 1 roster. The
threshold detector recovers 555 of these (≥10% prominence).
2.5 Causal Testing: Ablation and Activation Patching
We use two complementary causal tests at each identified CAZ peak. Activation patching here is not a novel method but a downstream validation step applied to CAZ-identified layers: the framework paper [Henry, 2026a §2.1] positions CAZ detection as upstream of the activation-patching toolkit [Vig et al. 2020; Meng et al. 2022; Wang et al. 2023; Chan et al. 2022; Goldowsky-Dill et al. 2023], with the threshold- and score-based region detectors (§2.4) supplying a principled choice of which layers to test rather than exhaustive layer sweeps. The results in §6 are therefore best read as causal validation of a geometric hypothesis, not as an independent patching study.
Projection ablation: Orthogonal projection removes the concept’s dominant direction from the layer output. The dominant direction at layer \(\ell\) is the normalised centroid difference \(u^{(\ell)} = (\mu_+^{(\ell)} - \mu_-^{(\ell)}) / \|\mu_+^{(\ell)} - \mu_-^{(\ell)}\|\), computed from the 250 positive and negative class activation centroids. The ablation operator is \(h' = h - (h \cdot u^{(\ell)}) u^{(\ell)}\) — standard orthogonal projection that zeroes the component of each hidden state along the concept axis while leaving orthogonal components intact. Two measurements per ablation: separation reduction (concept suppression, 250 contrastive pairs) and KL divergence from the unablated distribution (capability damage, 12 general-capability prompts).
Separation is remeasured at the model’s final-layer concept direction, not locally at the ablation layer — ablating \(u^{(\ell)}\) at layer \(\ell\) and then observing reduced separation at \(\ell\) itself would be close to definitional (the projected-out axis is exactly what separation there is computed along); measuring downstream, at final-layer output, is the informative test of whether the intervention’s effect propagates or is reconstructed by later layers (see §6.6’s restated scope note for the full statement). Self-retained separation is the fraction of pre-ablation Fisher separation remaining after ablation: \(\text{self\_retained} = S_\text{ablated} / S_\text{baseline}\), expressed as a percentage; a value of 30% means 70% of separation was suppressed. The ratio of suppression to KL damage ranks candidate intervention layers on the suppression-per-damage trade-off measured here.
Activation patching: Mean-shift patching [Turner et al. 2023; Panickssery et al. 2024; Li et al. 2023 — the difference-of-means activation-addition lineage; cf. Vig et al. 2020 for the broader causal-mediation framing] injects the concept at a layer from the opposite direction — instead of removing the signal, it adds it. For each layer \(L\), we compute the mean activation shift between positive and negative classes: \(\Delta_L = \mu^+_L - \mu^-_L\), add this shift to all negative hidden states at \(L\), and run the remaining forward pass normally. Performance is measured via concept score recovery:
\[\text{recovery}(L) = \frac{\bar{s}_\text{patched-neg}(L) - \bar{s}_\text{neg}}{\bar{s}_\text{pos} - \bar{s}_\text{neg}}\]
where scores are projections onto the final-layer concept direction — the normalised centroid difference \(u^{(N)} = (\mu_+^{(N)} - \mu_-^{(N)}) / \|\mu_+^{(N)} - \mu_-^{(N)}\|\) computed at the model’s last residual stream layer \(N\). All numerator and denominator terms are evaluated at this same fixed direction, so recovery measures how much of the model’s output-layer concept gap is restored by the patch.
Recovery of 0 means the layer is causally inert for injection; 1.0 means patching fully restores concept encoding at the output; >1.0 indicates overshoot (patched negatives exceed the positive class centroid). Ablation and patching together distinguish ablation-sensitive layers (ablation suppresses measured separation; patching restores measured separation) from injection-responsive layers (patching restores measured separation; ablation has no effect) — a dissociation that turns out to be architecturally informative (Section 6.4). We use “ablation-sensitive” and “injection-responsive” as the terminology for these roles throughout; both metrics fall short of 1.0, indicating partial redundancy even in MHA models.
2.6 Precision and Layer Indexing
Precision. All Fisher separation, coherence, and Procrustes computations are performed in float64 — this corrects a silent overflow discovered in fp16 Fisher normalization at deep layers of models with >36 layers.
Activation extraction and layer indexing. For each
text the residual-stream activation is read at the last
non-padding token (pool="last",
token_pos = -1); inputs are tokenized with
truncation=True, max_length=512,
padding=True. Class centroids \(\mu^\pm_\ell\) and the Fisher separation
\(S_c(\ell)\) are computed from these
per-text pooled vectors. Layer-indexing convention: the
model’s embedding output (the first of the \(n_\text{blocks}+1\) hidden states) is
dropped before analysis, so layer index \(\ell
= 0\) denotes the output of transformer block 0 — not the
token-embedding layer — and a model with \(B\) blocks yields \(B\) indexed layers \(0 \dots B{-}1\). References throughout to
an “embedding-layer” or “L0” CAZ (e.g. §3.3’s shallow credibility peaks,
Table 10’s negation peak, the §B “Embed CAZ” column, and Figure 3’s
“embedding-to-transformer transition”) accordingly denote block-0
output, the shallowest analysed layer, not the raw token embedding.
3. Concept Ordering
3.1 Cross-Family Ordering
Averaging CAZ dominant peak depth across all 28 base models and 17 concepts:
| Rank | Concept | Mean Depth (%) | Std | Category |
|---|---|---|---|---|
| 1 (earliest) | specificity | 21.4 | 24.9 | syntactic |
| 2 | plurality | 30.2 | 32.7 | syntactic |
| 3 | negation | 37.3 | 28.8 | syntactic |
| 4 | formality | 49.7 | 35.2 | register |
| 5 | credibility | 54.2 | 32.7 | epistemic |
| 6 | causation | 55.7 | 16.2 | relational |
| 7 | temporal_order | 55.9 | 18.9 | relational |
| 8 | certainty | 55.9 | 18.4 | epistemic |
| 9 | agency | 58.6 | 25.1 | relational |
| 10 | moral_valence | 58.7 | 18.8 | affective |
| 11 | deception | 60.0 | 28.1 | behavioral |
| 12 | sentiment | 63.6 | 17.9 | affective |
| 13 | threat_severity | 68.4 | 17.0 | behavioral |
| 14 | urgency | 68.6 | 10.6 | behavioral |
| 15 | authorization | 69.0 | 16.8 | behavioral |
| 16 | sarcasm | 70.2 | 19.7 | affective |
| 17 (deepest) | exfiltration | 81.0 | 15.0 | behavioral |
Table 3: Mean CAZ dominant peak depth across 28 base models from 8 architecture families, using the scored region detector (0.5% prominence floor); dominant = tallest Fisher-separation peak per concept per model (the composite-score-dominant sense of §6.4 is a different ranking). For multimodal concepts (§4.2), this is whichever of multiple peaks happened to be tallest.
The category-level pattern — syntactic/morphological shallowest (21–37%), register and epistemic/relational mid-stream (50–64%), behavioral concepts occupying the deepest positions (68–81%, with deception as the one behavioral outlier at 60%) — holds across all 8 architecture families (Figure 1), though the boundaries between adjacent categories are not sharp: several relational, epistemic, and affective concepts cluster tightly in the 56–64% band.
Within categories the ordering is largely consistent: specificity precedes plurality precedes negation among syntactic concepts; causation precedes temporal_order; and exfiltration is unambiguously the deepest concept (81.0%; deepest by mean depth in all cohorts and in 8 of 28 individual models), while deception sits mid-pack (60.0%) rather than among the deepest behavioral concepts. Concepts in the 56–64% band (causation through sentiment) show lower within-family variance than the extremes: these are the most architecturally stable positions — though “stable” here is inferred from variance alone, and low variance is confounded with low multimodality (fewer sub-representations to peak-switch between, §4.2) — the highest-std concepts (formality 35.2, plurality 32.7, credibility 32.7, negation 28.8, deception 28.1) are exactly the ones where peak-switching between sub-representations likely accounts for much of the spread, but we have not separately verified that this band’s concepts are less multimodal than the high-variance ones rather than independently more architecturally consistent.
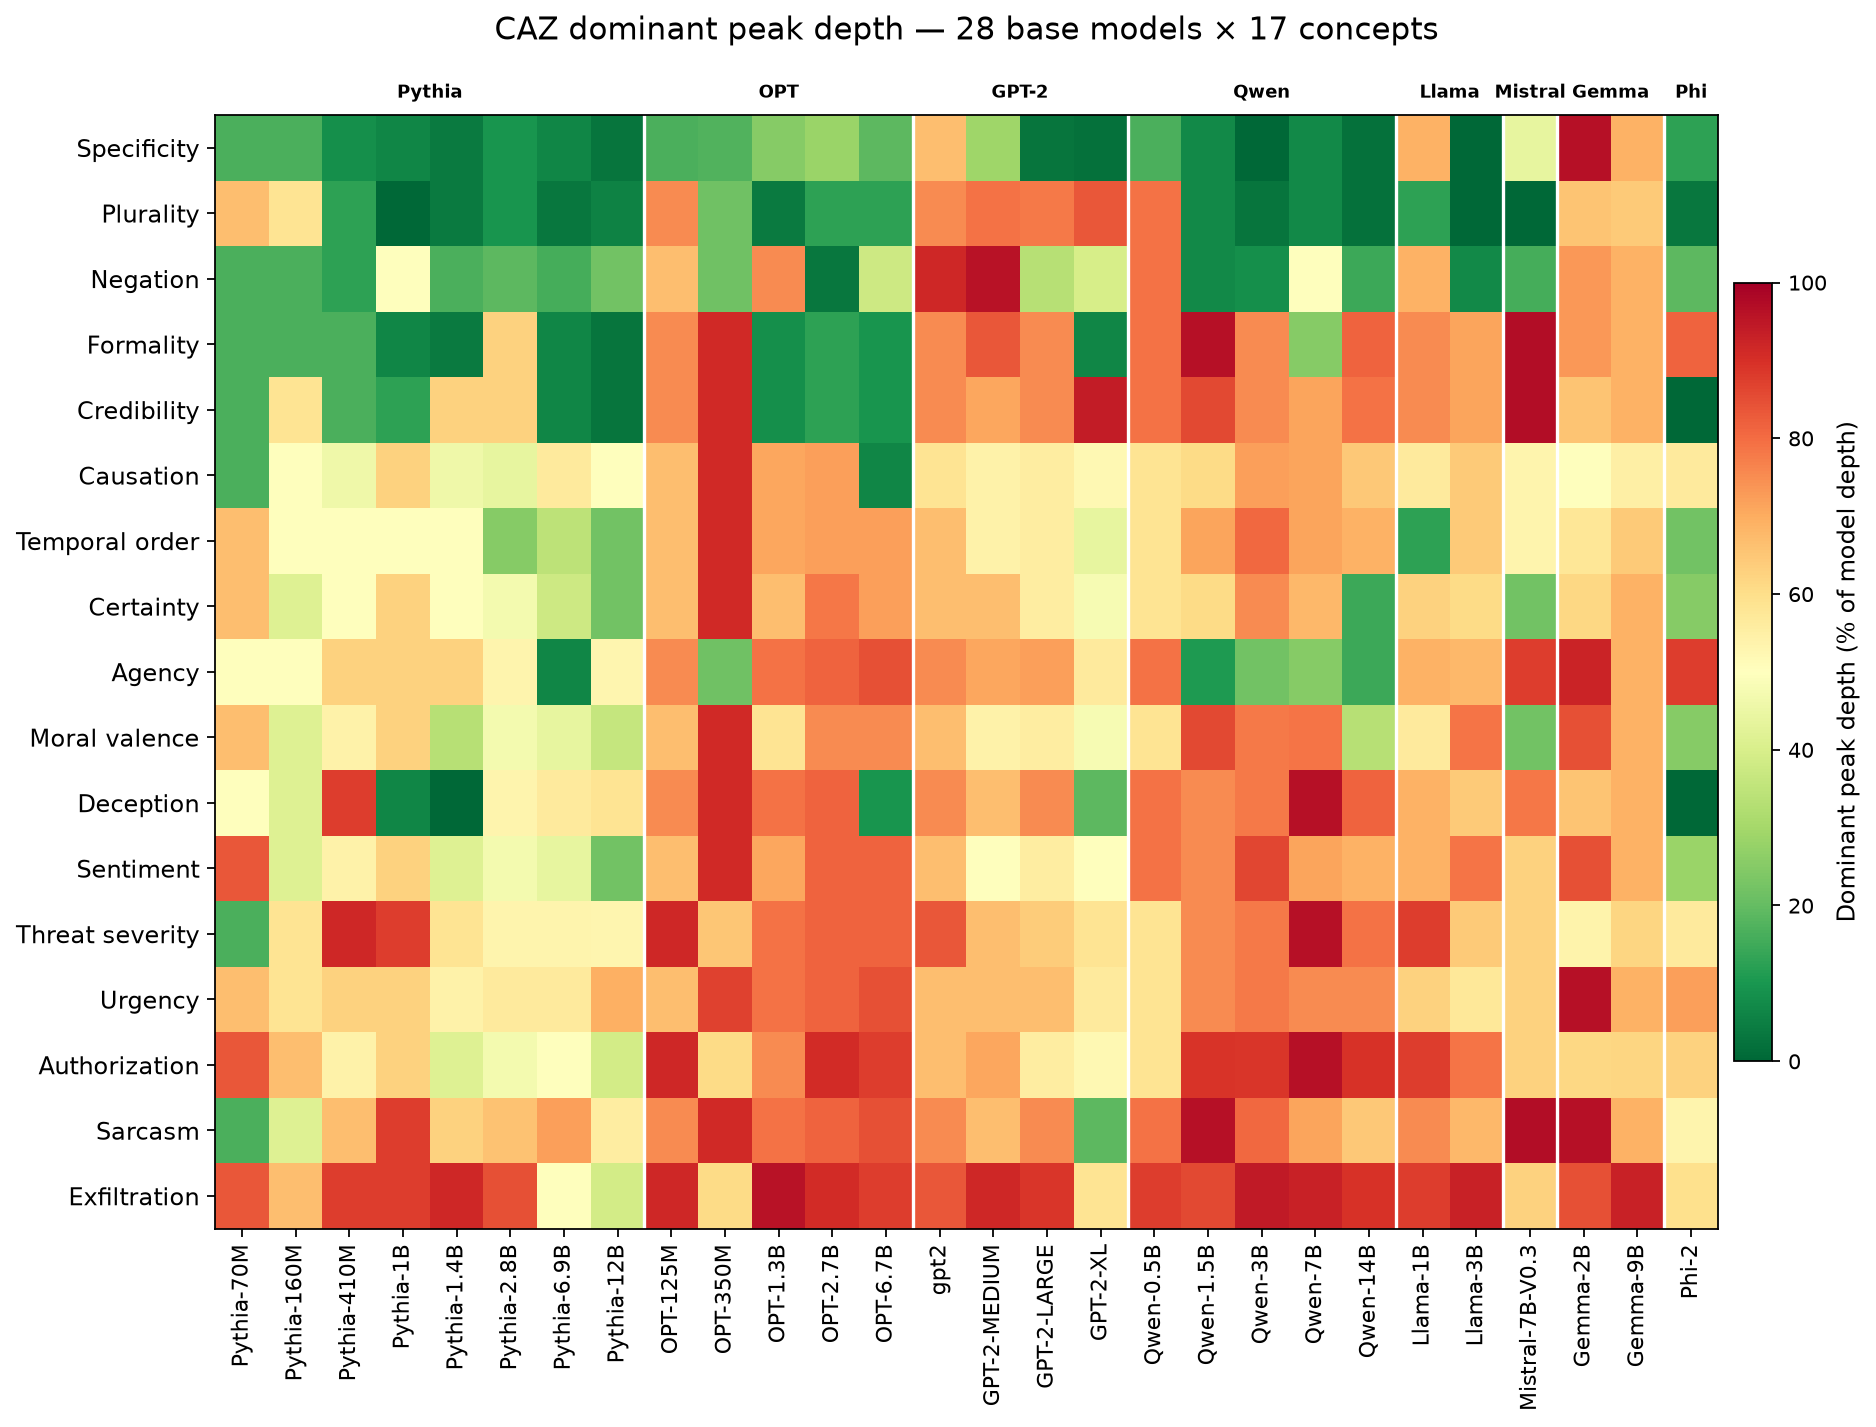
To quantify cross-model consistency, we compute Kendall’s \(\tau\) between each model’s 17-concept depth ranking and the grand mean ordering (Table 3). 27 of the 28 models show positive \(\tau\) and one (gpt2-medium) is exactly zero — a concordant/discordant tie in its 17-concept ranking, not a near-zero rounded down; none is negative. Per-model \(\tau\) ranges from 0.000 (gpt2-medium) to 0.796 (opt-2.7b); 16 of 28 are individually significant at p < 0.05. A Wilcoxon signed-rank test against zero drops the single zero and runs on the 27 non-zero models, all positive, so the test statistic sits at its extreme: sum of positive signed ranks = 378 = 27·28/2, the maximum possible for n = 27, giving p = 1.49×10⁻⁸ and confirming the ordering tendency is statistically significant. The median per-model \(\tau\) is 0.404 — moderate rank correlation.
By architecture cohort: MHA median \(\tau = 0.404\) (18 models), GQA+SwiGLU median \(\tau = 0.440\) (8 models), Gemma median \(\tau = 0.113\) (2 models, case study). The lower \(\tau\) in the smallest/shallowest models (gpt2-medium 0.000, gpt2 0.060, Qwen2.5-0.5B 0.101, opt-350m 0.105) is not limited layer depth: split-half recomputation shows three of the four measure their own orderings reliably (0.53–0.89, ceilings 0.83–0.97) while agreeing with the grand mean at 0.000–0.101, so they resolve a different ordering rather than fail to resolve the reference one; opt-350m is the exception, itself only weakly reproducible at 0.310 (§3.2, “Low-τ models”).
The Gemma cohort is low for the opposite reason: gemma-2-9b (42 layers, not small or shallow) has an individual τ of 0.125, near gemma-2-2b (0.100), but both have the least reliable orderings in the corpus (split-half τ 0.176/0.184), so their τ is not reliably estimated at N=250 and does not support an alternating-attention reorganisation reading (§3.2).
Stability varies by concept. Urgency (std 10.6), causation (std 16.2), and authorization (std 16.8) are the most consistent across architectures. Formality (std 35.2), plurality (std 32.7), and credibility (std 32.7) show the highest variance — a multimodality examined in §4.2.
3.2 Concept Set Scope and Per-Model Consistency
27 of the 28 models show positive \(\tau\) with the 17-concept grand-mean ordering, and one (gpt2-medium) is exactly zero — none negative (§3.1). This is stronger than the 7-concept analysis, where three models (Phi-2, GPT-2, GPT-2-medium) showed negative \(\tau\); the 10 additional concepts span a wider depth range (21–81%) and give a more stable reference, absorbing per-model perturbations into modest τ reductions rather than rank inversions (Phi-2, the most extreme C=7 inversion at τ = −0.25, is positive and mid-pack at C=17, τ = 0.418; §E). The consistency is statistically significant (Wilcoxon W = 0, sum-of-positive-ranks = 378 over the 27 non-zero models, p = 1.49×10⁻⁸), ranging from τ = 0.000 (gpt2-medium) to τ = 0.796 (opt-2.7b). The ordering is a robust statistical tendency, not a strict per-model invariant.
The tendency survives every robustness control we applied, each attenuating the median τ = 0.404 only slightly: leave-one-out (0.373), leave-one-family-out with an all-positive 8×8 between-family matrix (0.392), partialling out training-token frequency (0.380), and a reliability-ceiling analysis in which a single shared ordering would produce an observed median of ≈0.911 — more than double the 0.404 actually seen — corroborated by a within-vs-between split-half test (models resemble themselves at τ = 0.651 but each other at only 0.254). Full derivations, the token-frequency confound (discriminative-token frequency correlates with depth at Spearman ρ = −0.657, p = 0.004), and the topic-disjoint direction control are in supplementary §E. The one qualification these batteries leave standing: training-token frequency is a real but partial contributor at the shallow end (specificity, plurality, negation — all high-frequency, all shallow); it does not explain the mid-to-deep concepts and does not produce the cross-model agreement the result rests on (§E).
The four lowest-τ models outside the Gemma-2 pair (gpt2-medium, gpt2, Qwen2.5-0.5B, opt-350m) agree with the grand mean at only 0.000–0.105, and for three of them that is a reliable disagreement rather than a measurement artifact: they reproduce their own ordering across independent pair-halves at split-half τ 0.53–0.89. opt-350m is the exception — its own ordering is only weakly reproducible (0.310), so for that model limited depth resolution is not excluded (§E).
Gemma-2-9b (τ = 0.125, sixth-lowest) is a separate case and points the opposite way. It is neither small nor shallow (42 layers), and the natural reading has been that its alternating local/global attention reorganises where concepts peak relative to the standard-attention reference (the Gemma cohort effect noted in §3.1). The split-half data do not license that reading either: the two Gemma-2 models have the least reliable orderings in the corpus — split-half τ = 0.176 and 0.184, ranks 1 and 2 from the bottom of 28, against a corpus median of 0.717 (the next-lowest, opt-350m at 0.310, is closer to them than to the median, so the Gemma pair is the extreme of a continuum rather than a cleanly isolated cohort). At that reliability there is no stable Gemma ordering for the architecture to have reorganised — the measurement does not replicate against itself.
Independent evidence converges on this: Gemma-2’s dominant directions are also unstable under pair resampling (peak-layer split-half cosine 0.62–0.90 vs. ≥0.96 for GPT-2 and Qwen2.5-3B controls at the matched statistic, aggregation-robust — §6.9 — with extraction itself bit-deterministic). We therefore report Gemma-2’s ordering as not reliably estimated at N=250 rather than as architecturally reorganised, and the Gemma-2 cohort results throughout this paper (§4.2, §6.4, §8.3) should be read with that instability in mind.
§6.9 characterises the instability: the concept information is fully present (held-out probes at control-level AUC) but distributed across ~20–78 effective dimensions, which starves any single-direction point estimate at this sample size. We do not additionally report the pooled statistics with the two Gemma-2 models removed: at n = 2 of 28 their effect on any pooled figure is negligible, and — the point §6.9 makes — the cohort is an instrument limitation (an unreliable single-direction readout at N=250), not a competing signal, so an arithmetic exclusion would change no conclusion it is not already flagged against.
3.3 The Credibility Puzzle
Credibility ranks 5th of 17 (mean depth 54.2%) — mid-pack — yet has one of the highest cross-model variances of any concept (std 32.7, tied with plurality for second; exceeded only by formality’s 35.2, whose larger spread is inflated by multimodal peak-switching — see Table 3 caption). Three distinct behaviors emerge:
- Embedding leakage (9/28 models): Peaks below 25% depth. Models resolve credibility from surface lexical cues near the embedding layer.
- Late assembly (6/28 models): Peaks above 75% depth. Genuine multi-layer compositional assembly.
- Mid-stream assembly (13/28 models): Peaks at 25–75% depth, consistent with CAZ prediction.
(9 + 6 + 13 = 28 — a full accounting of the roster.)
The mean of 54.2% is an artifact of averaging across these three sub-populations: the embedding-leakage group pulls the mean down from the mid-stream cluster, the late-assembly group pulls it up, and the two effects partially cancel. Credibility’s mean rank is mid-pack; its distribution is bimodal.
The embedding-leakage count is partly generator-dependent: the multi-generator comparison (§C) shows credibility’s depth shifting with generator condition in a way that tracks this leakage structure — single-generator credibility pairs trigger embedding-level leakage in both GQA models tested, while multi-generator pairs resolve deep — consistent with the primitives underlying shallow credibility resolution varying across generation sources. (§C tests four models and does not tabulate sub-population counts across generator conditions; a full-roster generator-conditioned count comparison has not been run.)
GPT-2 family and Llama-3.2. All four GPT-2-family models place credibility deep — gpt2 75.0%, gpt2-medium 70.8%, gpt2-large 75.0%, gpt2-xl 93.75% — at, just below, or (gpt2-xl) above the 75% late-assembly boundary, with no scale inversion. Both Llama-3.2 base models are also mid-to-late (Llama-3.2-1B 75.0%, Llama-3.2-3B 71.4%), not embedding leakage. Neither family shows a scale- or size-dependent split for this concept; neither family contributes to the embedding-leakage sub-population.
Across all 28 models, the scored detector (0.5% floor) flags credibility as multimodal (shallow and deep peaks both present) in all 28. Table S6 (§J) reports the within-model cosine between shallow and deep peak directions under the stricter threshold detector’s (10% floor) smaller multimodal subset — that table is discussed separately in §4.2.
4. Scored Detection and CAZ Profiles
4.1 The Detection Gap
Threshold-based detection (10% prominence floor) identifies 555 CAZes across 28 × 17 = 476 model–concept pairs. Scored detection (0.5% prominence floor, composite scoring) identifies 1,045 total regions — the 490 additional regions are predominantly moderate (score 0.05–0.2; 33% of all scored regions) and gentle (score < 0.05; 15%), distributed more uniformly across depth than the threshold-captured major and strong CAZes.
Permutation null model. A natural concern is that lowering the prominence threshold simply captures noise fluctuations in the Fisher separation trace. We tested this directly: for each of 5 representative models (Pythia-70m, Pythia-1.4b, GPT-2-XL, Qwen-2.5-3B, Gemma-2-2b) × 7 concepts, we randomly permuted pos/neg labels within each contrastive pair 100 times and re-ran the full detection pipeline. As a sanity check, we included a sham “concept” — 100 pairs of randomly assigned texts with no semantic contrast.
The null model produces a comparable number of velocity peaks: approximately 1 per 5–10 layers regardless of whether labels carry concept signal (mean null peaks: 1.2 at 6 layers, 2.7 at 24, 6.4 at 36, 4.8 at 48; per-layer density ranges from 1/5 at 6 layers to 1/10 at 48 layers). Peak count is not diagnostic of concept structure — it is a property of the detection pipeline’s sensitivity to fluctuations in any non-monotonic trace. No real concept achieved p < 0.05 on peak count (0/35).
What distinguishes real concepts from noise is the separation magnitude at detected peaks. Across all 35 real model × concept combinations in the permutation-null subset (5 models × the 7 original concepts; the null was not re-run for the 10 later concepts), observed Fisher separation at the peak was 2–10× above the permutation null (p < 0.01 in all 35 cases; MHA models: 4–10×; alternating-attention: 2–3×). The sham concept was indistinguishable from noise on all 5 models (observed/null ratio 0.7–1.0×; p = 0.34–0.78). The pipeline correctly classified 40/40 combinations: every real concept significant, every sham non-significant — though with one sham concept per model the sham false-positive rate is 0/5, whose 95% upper bound is ≈52%, so this null bounds noise for these seven concepts rather than pinning a tight false-positive rate.
| N | Obs/Null sep ratio | p(sep) < 0.01 | |
|---|---|---|---|
| Real concepts | 35 | 2–10× | 35/35 (100%) |
| Sham concept | 5 | 0.7–1.0× | 0/5 (0%) |
Table 4: Permutation null model results across 5 architectures and 7 of the 17 concepts (the 10 later concepts have no null coverage; §1.1). 100 permutations per combination. Sham = 100 randomly paired texts with no semantic contrast.
The reported 1,045 CAZ regions and 2.20-per-pair mean should be understood in this context: the count is expected under noise; the signal is not. The permutation null was run on 5 representative models spanning both cohorts (Pythia-70m, Pythia-1.4b, GPT-2-XL, Qwen-2.5-3B, Gemma-2-2b); the remaining 23 models’ gentle CAZes are assumed to generalize from these results. The mechanism — concept signal vs. label-permuted noise — is architecture-independent, supporting the generalization, but it has not been confirmed model-by-model, and the 10 later concepts (including all five behavioral/safety concepts) were not tested against the null at all. What makes these peaks meaningful is not their number but their separation magnitude (confirmed here) and their causal efficacy (confirmed by ablation in §6.1).
Peak CAZ activity occurs at 50–60% depth (80 CAZes, mean score 0.339). The 30–40% range is the quietest (62 CAZes, mean score 0.099), creating a relative void between early processing and main allocation. This depth distribution may partially reflect a generic property of transformers — middle layers are routinely identified as the locus of abstract processing in unrelated work — rather than a concept-allocation-specific effect.
A note on score interpretation across architectures. CAZ scores reflect both semantic geometry and architectural amplification. In MHA architectures, the score distribution is more concentrated into high-score peaks — producing high scores that correlate with genuine ablation impact. In GQA and alternating-attention architectures, that concentration is absent or attenuated: the same semantic function registers as a lower (or locally identical) score. A plausible explanation is that per-layer attention reinforces the concept direction more strongly in MHA than in GQA/alternating-attention architectures, but this reinforcement mechanism is not directly tested here — the data support the score-distribution pattern, not the mechanism behind it. Gemma-2, for example, produces scores in the strong-to-major range (0.26–0.60) at its identified peaks yet shows only weak Fisher-peak ablation (0.367 mean); §6.9 shows these cells are uninformative about Gemma’s causal structure — its concept code is distributed, so a single-direction ablation must register weakly — rather than evidence of causal inertness. The score categories (major CAZ, strong, moderate, gentle) are meaningful within an architecture family; cross-family comparisons require the architecture-conditioned analysis in Section 6.4. The aggregate count of 1,045 CAZ regions comes from the scored detector (§2.4), whose region boundaries are set by peak-finding on the Fisher separation series alone: the architecture paradigm enters only the post-detection score, so the counts are architecture-independent by construction (verified — forcing each paradigm label leaves every region count unchanged). The score categories are descriptive labels applied after detection and should not be read as functionally equivalent across architecture families.
4.2 Multimodal Allocation
Concepts do not assemble at a single layer. Across 28 models and 17 concepts (476 model–concept pairs), 76.3% of pairs are multimodal (363/476), with a mean of 2.20 detected CAZ regions per pair. Architecture drives multimodal rate: MHA models 69.6% multimodal (213/306 pairs), GQA+SwiGLU models 94.1% (128/136), Gemma 64.7% (22/34). As shown in §4.1, the peak count itself is not diagnostic — the permutation null produces a comparable number of velocity peaks in any non-monotonic trace. What makes these peaks meaningful is the separation magnitude at each peak (2–10× above null, §4.1) and the causal efficacy of ablation at those peaks (3.59× greater suppression than at peak-distal layers, §6.1). This multimodal rate is not an artifact of the smoothing window: the scored detector never reads velocity, and re-running it with velocity recomputed at k ∈ {adaptive, 12, 24, 48} returns 363/476 at every setting (§2.3).
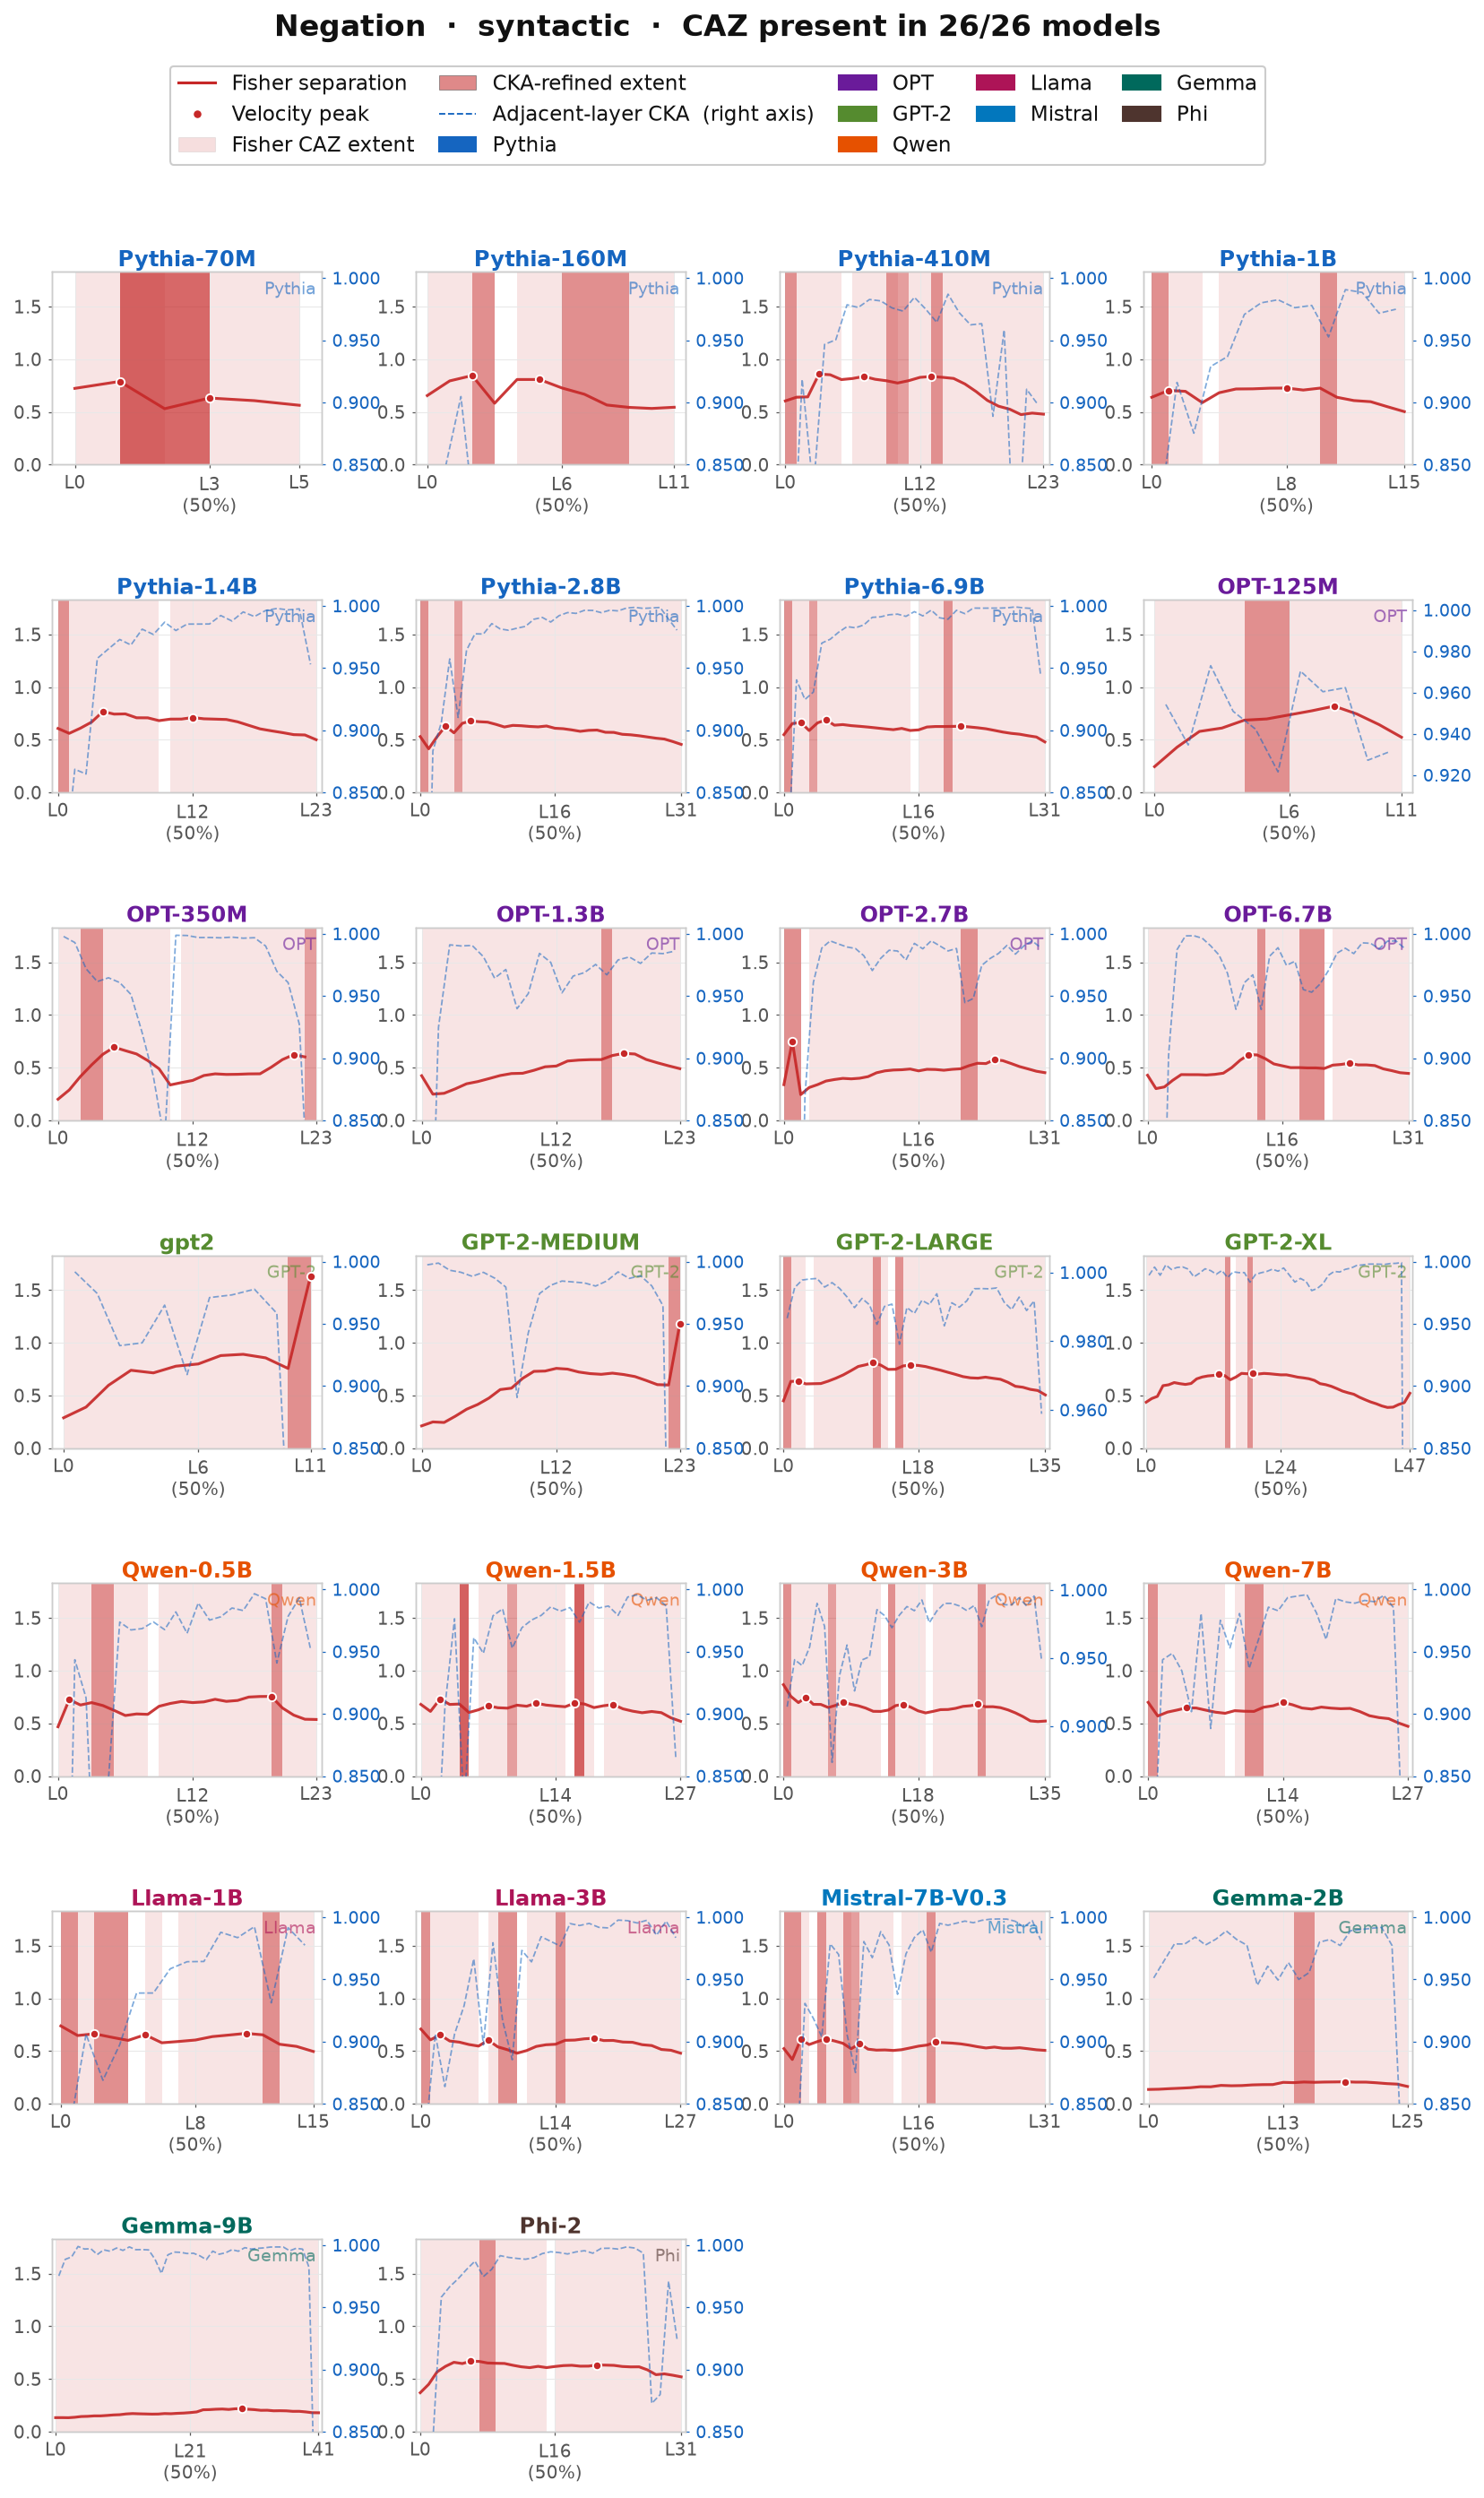
The sub-representations at different depths are geometrically distinct: within-model cosine between shallow and deep peaks runs 0.12–0.41 (Table S6, §J) — well above the random baseline (|cos| ≈ 0.02) but well below identity, consistent with either genuinely distinct sub-representations or a single direction rotating gradually across depth; the farther apart the peaks, the more different the directions (\(r = -0.496\), \(p = 0.0005\)). Distinguishing these requires showing the inter-peak transition is discontinuous rather than smooth, which the current data do not resolve. An independent boundary check bears on this and returns a genuine null: separation saddle points co-locate with direction-rotation events in 50% of cases, indistinguishable from a 53% permuted baseline — either the two track distinct phenomena or the saddles are not structurally meaningful boundaries; we report it without privileging either reading (§J).
Multi-modality does not correlate with model scale (\(\rho = 0.11\), \(p = 0.63\)); it varies by family (Qwen 2.5 deep bimodality, dips 26–36%; Gemma 2 subtle, 8–15%; GPT-2 and Pythia intermediate). The inter-peak saddle is not concept absence: across 895 inter-peak saddle points, separation at the saddle retains a mean 89% of adjacent-peak separation (median 92%; ~79–82% in MHA, >95% in alternating-attention models) — the concept is geometrically present throughout, the saddle marking reduced assembly velocity, not a gap.
4.3 Depth-Dependent Concept-Pair Geometry
After Procrustes alignment into a shared coordinate space, concept pairs show consistent depth-dependent geometry (Table S7, §J): causation × temporal_order converge with depth (20/20 same-dimension model pairs), while credibility × certainty and sentiment × moral_valence diverge (20/20 and 18/20). Only the direction of each depth-dependent change is reported, not absolute cosines: aligning 17 concept directions in \(d \gg 17\) dimensions leaves the Procrustes rotation heavily underdetermined (≈136 constraints for \(d(d{-}1)/2\) degrees of freedom), so magnitudes — and the sign of small deltas — may be inflated by overfitting. Table S7 was not run through the random-vector and label-shuffle nulls that would rule out an underdetermined rotation manufacturing structure, which is why its cosines stay unreported while only the directional pattern is claimed (§J). This is, categorically, a small instance of the same cross-architecture alignment machinery — an orthogonal Procrustes rotation fitted between same-dimension model pairs — that §5.5 and §8.5 decline to run at scale; it is reported here only as a within-paper geometric observation on 20 model pairs, not as evidence toward the cross-architecture convergence question those sections defer to companion work.
The pattern’s mechanism is unresolved. A semantic-relatedness reading is equally compatible: causation and temporal order are distributionally related, and credibility and certainty share shallow surface cues that dissociate at depth — so the converge/diverge pattern may be downstream of shared training corpora rather than of concept-allocation dynamics. The 20/20 consistency establishes that the geometry is robust, not that it is caused by allocation; distinguishing the readings needs either non-overlapping training corpora or a mechanistic shared-direction ablation (§4.5), neither of which has been run (§J).
4.4 Family-Level Score Distributions
Scored detection reveals distinct family-level patterns in how the pipeline’s metrics distribute across architectures:
- Gemma 2: The highest major-CAZ share of any cohort (12.5 major CAZes per model on average, 33.3% of Gemma-2 regions — §8.3), consistent with its alternating local/global attention reinforcing the concept direction at global-attention layers much as full MHA attention does. This scored-detection concentration is distinct from the cohort’s causal behavior at the Fisher peak (§6.4, §8.3): Gemma-2 regions are geometrically prominent but the peak itself is frequently not the most ablation-sensitive region (§6.4).
- Qwen 2.5: High CAZ counts (51–65 per model at C=17) with many gentle CAZes. Broad distribution across depth.
- GPT-2: Fewer but stronger peaks. More concentrated separation changes with higher mean scores.
- Small models (Pythia-70m, OPT-125m): High CAZ-per-layer density (1.9–4.7 at C=17). This is partly arithmetic — fewer layers compress the same detection events into a smaller space.
These differences are expected: different architectures produce different score distributions. Whether they reflect distinct functional strategies or are simply measurement artifacts of running the same pipeline on different architectures is not resolved by the score distributions alone. The causal analysis in §6 provides partial disambiguation.
4.5 Cross-Concept Shallow Sharing
Shallow-peak dominant directions reveal shared structure across concepts (mean |cos| across all 28 base models):
| Concept Pair | Mean cos(shallow) | Notable |
|---|---|---|
| causation × temporal_order | 0.284 | Relational concepts share primitives |
| causation × credibility | 0.133 | opt-6.7b: 0.952 — near-identical direction |
| causation × negation | 0.114 | opt-6.7b: 0.847 |
| certainty × credibility | 0.101 | |
| credibility × sentiment | 0.070 | Unrelated |
Table 5: Cross-concept cosine similarity of shallow-peak dominant vectors (mean |cos| across all 28 base models, threshold-detector shallow peak). Most cross-concept pairs are weakly aligned at shallow depth; the relational pair causation × temporal_order is the most consistently shared, while individual models occasionally show a near-identical shared shallow direction (opt-6.7b: causation × credibility 0.952). Pairs are drawn from six of the seven original concepts (causation, temporal_order, credibility, negation, certainty, sentiment; moral_valence contributes no tabulated pair); this cross-concept sharing analysis has not been extended to the 10 later concepts, so it is not a claim about all 17 concepts’ shallow-sharing structure — only about the six tabulated here.
In opt-6.7b, the shallow CAZ for credibility is essentially the same feature as the shallow CAZ for causation (cos 0.952). On average across the 28 models, cross-concept shallow sharing is weak (mean |cos| 0.07–0.28), strongest for the relational pair causation × temporal_order (0.284); the near-identical opt-6.7b direction is a per-model extreme, not the typical case. This is consistent with the standard finding in probing studies that early layers encode generic features while later layers encode task-specific ones. One interpretation is that the unit of analysis at shallow depths is a shared allocation primitive — a discrete computational direction that multiple concepts share before diverging at depth. An equally valid interpretation is that early layers simply have not yet separated semantically related concepts: the shared direction reflects incomplete processing, not a functional primitive. Distinguishing these interpretations would require showing that the shared shallow direction is itself a causal unit (e.g., that ablating it disrupts both concepts). That experiment has not been run.
5. Prediction Scorecard
The CAZ framework [Henry, 2026a] generated testable predictions. We evaluate each against the 28-model dataset.
These seven predictions were pre-specified by the framework’s author on 2026-04-05 and published prior to running this validation pipeline [Henry, 2026, pre-registration]; they were not submitted to a formal external registry such as OSF [Henry, 2026a §5]. We use three verdict categories: Supported (prediction holds), Partially supported (direction correct, stated mechanism or magnitude wrong), and Not supported / Not testable as stated (specific claim failed or premise invalidated); one prediction (P7) is additionally graded Indeterminate — an underpowered test with no formal architecture-conditioned alternative constructed (§5.7). Because the same author specified the predictions, ran the tests, and assigned the verdicts, these are author-evaluated verdicts — data and code are released to enable independent replication, which would carry more evidential weight, and the self-evaluation risk is stated explicitly in §8.7. One of the seven, P5, concerns cross-architecture convergence and falls outside this paper’s within-model instruments; it is deferred to dedicated companion work rather than graded here (§5.5).
The full scorecard is summarized below; each row is developed in the subsection noted, and the narrative synthesis is in §5.8.
| Prediction | Pre-specified claim | Verdict | Key empirical driver |
|---|---|---|---|
| P1 Optimal ablation depth (§5.1) | Ablation within the CAZ gives the best suppression-to-damage ratio | Partially supported | Region level holds (73.1% of optimal layers within-CAZ); peak selection fails — the dominant CAZ is not the most ablation-sensitive region in 50.3% of multimodal cases (§6.4) |
| P2 Architecture-stable ordering (§5.2) | Concept-assembly depth ordering is stable across architectures | Partially supported | A real cross-model tendency (median τ = 0.404, W = 0, p = 1.49×10⁻⁸) but moderate rank correlation, not a strict invariant |
| P3 Width scales with abstraction (§5.3) | More abstract concepts have wider CAZes | Partially supported | Direction confirmed (Spearman ρ = 0.307, p = 3.7×10⁻¹⁸) but a modest effect on an author-assigned abstraction ranking |
| P4 Concept handoffs / bandwidth recycling (§5.4) | Post-CAZ re-entanglement tracks unembedding structure | Not testable as stated | Its single-peak precondition is invalidated by multimodal allocation (mean 2.20 CAZ regions per pair, §4.2) |
| P5 Depth-stratified convergence (§5.5) | Multimodal concepts show depth-matched cross-architecture alignment | Deferred (companion work) | A cross-architecture-convergence claim needing cross-model alignment machinery outside this within-model study; evaluated in [Henry, 2026d, in preparation] |
| P6 Lexical vs. compositional identity (§5.6) | Shallow peaks track token embeddings; deep peaks do not | Not supported | Token-embedding probing ≈ 0.02 at both shallow and deep peaks; the designed test failed (Wilcoxon p = 0.82) |
| P7 Multi-modality is architectural (§5.7) | Multi-modality frequency varies by architecture, not scale | Indeterminate | Scale correlation near zero (ρ = 0.11, p = 0.63, n = 26) but underpowered, and no formal architecture-conditioned alternative was constructed |
Table 6: Prediction scorecard. None of the seven pre-specified predictions is confirmed outright — three partially supported, one indeterminate, one not testable as stated, one not supported, and one (P5) deferred to companion work. Verdicts are evaluated at the full C=17 / N=250 / 28-model scope.
5.1 P1: Optimal Ablation Depth — PARTIALLY SUPPORTED
Prediction: Ablation within the CAZ produces the best suppression-to-damage ratio.
Result: Across 476 model–concept global sweeps, 73.1% of optimal ablation layers fall within the CAZ region (21.6% post-CAZ, 5.3% pre-CAZ; MHA 79.7% / GQA 60.3% / Gemma 64.7% within; dominant scored region). The location claim is supported at region level. The stronger reading — that CAZ score identifies the single most causally-active region among a concept’s multiple CAZes — is not borne out: the composite-score-dominant CAZ is not the most ablation-sensitive region in 50.3% of multimodal cases (§6.4), so geometric score localizes the causal zone but does not by itself rank within it. P1 is supported as a region-level claim and not as a peak-selection claim. Separation reduction is roughly constant across a band of layers within the CAZ (within-CAZ CV 0.02–0.26 for MHA), so projection ablation succeeds across the committed band; what varies more sharply is collateral damage. (This is consistent with the separate finding that post-CAZ layers are more efficient per unit of KL damage, §6.1/§8.7: the layer that maximizes raw separation reduction is within-CAZ, whereas the layer that maximizes suppression-per-damage is typically post-CAZ — two different optima.) This region-vs-ranking distinction, together with the patching result that CAZ peaks are nonetheless valid injection sites (MHA 0.672 / GQA 0.770 recovery; §6.4), sharpens the peak-vs-causal-region distinction documented in §6.4 and §6.6. The sharpness of the optimum differs by architecture era — broad in legacy MHA, narrow in modern GQA/Gemma — a real difference in optimum shape rather than in ablation magnitude (the cohorts are comparable on magnitude, §6.4/§8.3); the era-sharpness table (Table S4) and CV analysis are in §F.
5.2 P2: Architecture-Stable Ordering — PARTIALLY SUPPORTED
Prediction: The relative ordering of concept assembly depths is stable across architectures.
Result: 27 of 28 base models show positive rank correlation with the 17-concept mean ordering and one (gpt2-medium) is exactly zero, with none negative (median \(\tau = 0.404\); Wilcoxon W = 0 (sum-of-positive-ranks = 378 over 27 non-zero models), p = 1.49×10⁻⁸). At C=7, three models showed negative τ; expanding to 17 concepts eliminates all inversions (§3.2). The tendency is real and statistically robust — but \(\tau = 0.404\) is moderate rank correlation, not the stable ordering the prediction claimed. Low-τ models (gpt2-medium τ=0.000, gpt2 τ=0.060, Qwen2.5-0.5B τ=0.101) reflect reliable ordering disagreement rather than measurement failure (§3.2); gemma-2-9b τ=0.125 is not reliably estimated at N=250 (§3.1, §6.9). The ordering is a significant cross-architecture tendency, not a strict invariant.
5.3 P3: Width Scales with Abstraction — PARTIALLY SUPPORTED
Prediction: More abstract concepts have wider CAZes.
Result (C=17, N=250; \(n =
765\) CAZ sweeps across 45 models (17 concepts; the extended
corpus — Table 1’s 28 base models, 9 instruct-tuned variants, and 8
additional scale/frontier models: Qwen2.5-32B/72B,
Llama-3.1-8B/8B-Instruct/70B, Gemma-4-26B-A4B/-it, falcon-40b — the
deepest of which exceed 60 layers)): The Spearman rank correlation
between a priori abstraction rank and CAZ width (as a proportion of
model depth) is \(\rho = 0.307\), \(p = 3.7 \times 10^{-18}\) (the underlying
width_abstraction_C17.json observations exclude a stray
gpt_neo_125m directory not in any documented roster — the
same contamination check applied in §6.2’s dependency-structure
analysis). Morphosyntactic concepts occupy the narrow end of the
distribution (specificity: 25.5%, negation: 37.0%, plurality: 38.4% of
model depth); higher-abstraction concepts tend wider (sarcasm: 80.9%,
threat severity: 74.0%, deception: 65.7%). Formality is the primary
exception: ranked low in abstraction but with mean CAZ width 68.2%,
consistent with its dual morphosyntactic-pragmatic character. Two
qualifiers apply: the pooled p-value treats 765 sweeps that share models
and concepts as independent and is not cluster-corrected (unlike the
§6.1 enrichment result), so the modest effect size (\(\rho = 0.307\)) and its direction, not the
pooled p, are the evidentiary content; and the abstraction ranking is
author-assigned — the external ranking the framework pre-specified
(WordNet depth or concreteness ratings [Henry, 2026a]) was not carried
out, so replication against an externally sourced ranking remains
open.
The relationship holds across all 17 concepts including credibility, which previously confounded the C=7 test (\(p = 0.186\) with credibility included at \(n = 132\); at \(n = 765\) the effect is robust with all concepts present). The expanded concept set confirms the predicted direction: compositional semantic categories (deception, sarcasm, exfiltration) cluster toward wider CAZes; morphosyntactic features (specificity, plurality, negation) occupy the narrowest widths. Agency, the most abstract concept, shows mean width 61.3% — wider than morphosyntactic categories but narrower than sarcasm and threat severity, consistent with high within-model variance in abstract concept encoding.
5.4 P4: Concept Handoffs and Bandwidth Recycling — NOT TESTABLE AS STATED
Prediction: Post-CAZ re-entanglement correlates with unembedding matrix structure — concepts whose associated vocabulary tokens are distributionally similar re-entangle faster [Henry, 2026a].
Result: The prediction assumes a single CAZ peak per concept per model. Multimodal allocation (mean 2.20 CAZ regions per model–concept pair across 17 concepts; §4.2) invalidates this assumption — apparent “decay” between peaks is not degradation but inter-CAZ gaps where the geometric direction is reallocated. The prediction as stated is not testable against multimodal data.
An informative failure. Reframing decay as post-chain degradation — separation loss from the final CAZ peak to the last layer — reveals structure that the original prediction was reaching for but could not formalize: remaining depth after the final CAZ predicts how much separation is lost by the output layer.
Results (a) (476 measurements, 28 base models × all 17 concepts): remaining depth predicts decay, \(r = -0.265\), \(p < 0.001\). More layers between the final CAZ and the output = more separation loss. Mean decay ratio 0.848 (concepts retain ~85% of peak separation through to the final layer; per-concept breakdown in Table 7).
Results (b) (182 measurements, 26 models × the 7 original concepts — this sub-analysis keys on hand-curated concept-relevant token lists that have not yet been built for the 10 later concepts): unembedding token clustering, \(r = 0.173\), \(p = 0.019\). Concepts whose tokens cluster more tightly in unembedding space decay less. Significant but weak — proximity to the output layer is the dominant factor; unembedding structure contributes modestly.
| Concept | Final Peak (%) | Decay Ratio | Remaining Depth (%) |
|---|---|---|---|
| formality | 79.4 | 0.932 | 19.3 |
| exfiltration | 89.6 | 0.918 | 10.0 |
| sarcasm | 79.7 | 0.906 | 19.4 |
| credibility | 78.7 | 0.904 | 20.2 |
| authorization | 77.6 | 0.893 | 21.5 |
| plurality | 75.1 | 0.890 | 23.9 |
| urgency | 73.6 | 0.889 | 25.3 |
| deception | 75.7 | 0.883 | 23.2 |
| agency | 72.0 | 0.872 | 26.7 |
| threat_severity | 74.8 | 0.864 | 23.9 |
| sentiment | 70.4 | 0.848 | 28.4 |
| specificity | 64.9 | 0.830 | 33.5 |
| moral_valence | 69.2 | 0.821 | 29.5 |
| negation | 67.0 | 0.770 | 31.6 |
| causation | 64.4 | 0.752 | 34.1 |
| temporal_order | 64.2 | 0.749 | 34.3 |
| certainty | 65.9 | 0.700 | 32.7 |
Table 7: Post-chain degradation by concept (28 base models × all 17 concepts). Concepts with later final peaks and less remaining depth show less decay.
Both boundaries of the transformer constrain what we measure: embedding-layer CAZes reflect tokenizer features rather than transformer computation, and post-chain decay is shaped by proximity to the unembedding projection. A dedicated analysis of how token-space structure at both ends constrains concept geometry in the intervening layers remains future work.
5.5 P5: Depth-Stratified Convergence — DEFERRED (cross-architecture convergence; not evaluated here)
Prediction: Multimodal concepts show depth-matched cross-architecture alignment.
Status: not evaluated in this paper. P5 is the one framework prediction that concerns cross-architecture representational convergence — a claim in the register of the Platonic Representation Hypothesis (PRH) [Huh et al., 2024] about whether independently trained models converge on shared concept geometry. Adjudicating it requires cross-model alignment machinery — a per-concept rotation fitted between architectures, together with the depth-stratification and null controls that go with it — rather than the within-model CAZ detection and causal-ablation instruments this validation study is built on and reports throughout §§4–7. It is therefore evaluated in dedicated companion work on cross-architecture convergence [Henry, 2026d, in preparation] and is not scored on this paper’s scorecard; we import no alignment magnitudes from it here.
The dependence runs one way: the convergence analysis takes CAZ/GEM-detected concept directions as its input; a validation study establishing that those directions are real and causally active (the business of §6) is upstream of any claim about how they align across architectures, not downstream of it. Folding the convergence result into this paper would invert that order and make a causality-of-CAZ-structure result contingent on a representational-alignment result that depends on it. We therefore report only what this paper’s own instruments measure, and let the cross-architecture convergence question be settled on its own evidence, in its own venue.
5.6 P6: Lexical vs. Compositional Identity — NOT SUPPORTED
Prediction: Shallow peaks correlate with token embeddings (lexical); deep peaks do not.
Result: The designed test failed — token embedding probing yields cosine ~0.02 at both shallow and deep peaks (Wilcoxon \(p = 0.82\)). Neither peak’s dominant direction resembles raw token embeddings. The prediction is not supported.
Three independent findings suggest that shallow and deep peaks are qualitatively distinct, but none of them test the specific lexical/compositional prediction:
Cross-model conceptual convergence (Section 5.5): whether the same concept directions converge across independently trained architectures is a PRH-scope question, addressed in dedicated companion work [Henry, 2026d] rather than here. If such convergence holds, shallow and deep peaks may still be qualitatively different kinds of thing — but that distinction is not something a cross-architecture alignment test can establish, and this paper does not rest the point on it.
Cross-concept shallow sharing (Section 4.5): shallow peaks are partially shared across concepts before diverging at depth (causation × temporal_order cos 0.284 on average — the most consistently shared pair; individual models occasionally reach ~0.95, e.g. causation × credibility in opt-6.7b; most other pairs 0.07–0.14). Shallow representations are more generic — consistent with surface processing, but “generic” is not the same as “lexical.”
Credibility embedding leakage (Section 3.3): 9/28 models resolve credibility below 25% depth from surface lexical cues, while the complementary deep sub-representation encodes the same concept via a geometrically distinct direction (within-model cos 0.405). This is the closest evidence for the lexical/compositional distinction, but it is one concept, not a general result.
The broader premise — that shallow and deep peaks represent qualitatively distinct processing regimes — is well-motivated by this indirect evidence. But the prediction as stated was tested and failed. A more direct test — per-token position analysis, attention knockout at shallow vs. deep peaks, or probing classifiers trained on surface vs. contextual features — remains future work.
5.7 P7: Multi-Modality Is Architectural — INDETERMINATE
Prediction: Multi-modality frequency varies by architecture, not scale.
Result: The scale correlation is near zero (\(\rho = 0.11\), \(p = 0.63\); n = 26 models — this correlation has not been recomputed on the full 28), but at this n the test has low statistical power — the 95% CI for \(\rho\) includes values up to ~0.47, so the data is consistent with both no scale effect and a moderate one. Absence of a significant correlation is not evidence for the prediction. The qualitative family-level differences are real — Qwen shows deep, prominent bimodality; Gemma shows subtle bimodality that falls below the 10% prominence threshold (family-level multimodal structure is characterised in §4.2) — but these are descriptive observations, not a formal test of the architectural claim. The architectural difference is in the depth of the valley between peaks (degree of sub-representation separation), not a binary presence/absence. We classify P7 as INDETERMINATE rather than partially supported: the scale test is underpowered, and we never constructed a formal architecture-conditioned alternative to test against it. Resolving this requires either a larger same-architecture scale ladder or a pre-registered architecture-level test.
5.8 Scorecard Summary
Of seven predictions, this paper scores six with its own CAZ/GEM instruments and defers one. None is confirmed outright. Three are partially supported (P1: optimal ablation depth — region-level yes, peak-level no; P2, P3), one is indeterminate (P7: architecture-conditioned multi-modality — underpowered test, no formal architectural alternative), one is not testable as stated (P4: concept handoffs — its single-peak precondition is invalidated by multimodal allocation), and one is not supported (P6: lexical vs. compositional identity). The seventh, P5 (cross-architecture depth-stratified convergence), is a PRH-scope claim outside this validation’s instruments and is evaluated in dedicated companion work [Henry, 2026d, in preparation] rather than scored here (§5.5).
The scored verdicts are evaluated at the full C=17 / N=250 / 28-model scope. The framework paper [Henry, 2026a] records its own per-prediction assessments at its original C=7 scope (its ordering recompute covers the 29 base models carrying all seven concepts) and, by editorial choice, was left there; where the two papers differ, the difference is one of evaluation scope (C=17 vs. the framework’s C=7) and of method — this validation additionally brings the GEM zone-level ablation protocol (§6.5), which the framework paper does not — not chronology (P1’s assessments already cite these C=17/N=250 results).
That none of the seven pre-registered predictions is confirmed outright is not a failure of the exercise: the framework’s value is the CAZ/GEM machinery this paper validates as causally real (§6). The partial and failed results are informative in their own right. P1’s peak-level failure sharpened the peak-vs-causal-region distinction (§6.4, §6.6) and motivated the GEM zone-level ablation protocol (§6.5). P4’s failure exposed the multimodal allocation structure that the single-peak assumption had obscured (§4.2). P6’s failure narrows the space of viable tests for the shallow/deep distinction. Lowering the detection threshold — a separate methodological choice, not a prediction failure — independently exposed the causally active gentle-CAZ band (§6.1).
6. Ablation and Patching Evidence
Scope note. Throughout §6, “causal” is operationalized in the mechanistic-interpretability sense [Pearl, 2000; Geiger et al., 2021; Meng et al., 2022]: an intervention at a specific layer produces a measurable effect on the target representation downstream. Concretely, projection ablation produces a separation reduction at the model’s final-layer concept direction, and activation patching produces a separation recovery there. This intervention→representation-change relationship is the standard definition of causal identification for claims about layer function — it establishes that CAZ-identified layers are sites at which the concept can be removed from or reinstated into the forward pass. Downstream behavioral outcomes (next-token probabilities, task performance, generation steering) are a natural follow-up question addressed by the behavioral pilot in §6.8, which confirms direction-specific suppression across 27 of the 28 base models (random-direction ablation ≈ 0 in every cohort); peak advantage over a matched midpoint control is not statistically established at this probe count. §2.5 situates the method within the mechanistic-interpretability causal-testing lineage; §6.6 returns to the scope explicitly.
A recurring finding across §6.1–6.5: causally-active structure clusters near CAZ peaks and GEM handoff layers in aggregate, but no single chosen layer — peak or handoff — is reliably the right one for an individual concept × model pair. The geometrically dominant peak is not the most causally-active region in roughly half of multimodal cases (§6.4); the handoff layer beats the peak about two-thirds of the time, not all of it (§6.5); and no single-layer choice shows a reliable behavioral advantage over a matched control (§6.8). §6.6 synthesizes what this means for peak selection.
6.1 Gentle CAZes Are Ablation-Sensitive
Ablation at every CAZ score level shows causal efficacy is broadly distributed across the score spectrum, not concentrated in high-prominence features. Across 395 per-CAZ ablations (28 base models × 7 multimodally-structured concepts), all four score categories suppress concept separation by >60 pp on average and clear a 20 pp threshold in >95% of cases; gentle CAZes (score < 0.05) reach 63.2 pp mean suppression — only 7.5 pp below major CAZes — and 98% of them exceed the mean peak-distal layer. A 10%-prominence detector would discard the 194 gentle-or-moderate features (roughly half the detectable causal structure), yet those remain causally active in >95% of cases: score predicts geometric salience, not whether a feature is causally active (full table, detector-margin analysis, and the coverage caveat that this table covers only the 7 original concepts — not the 5 behavioral/safety ones — are in §H). Figure 3 illustrates the dissociation on a credibility example.
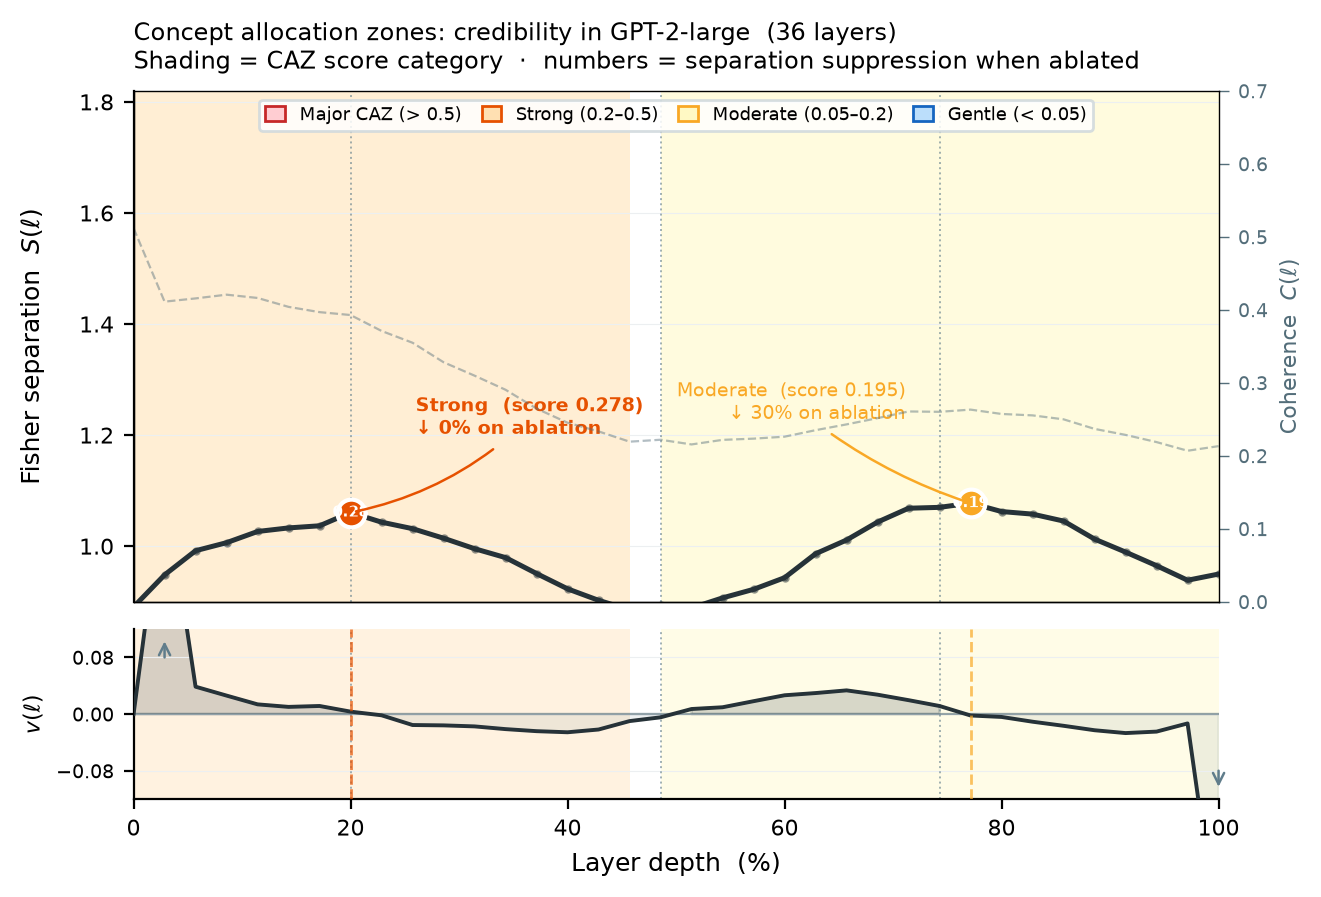
CAZ peaks are layer-specific. A global ablation sweep across all 28 base models — projecting out the concept direction at every layer — compares CAZ peak layers against peak-distal layers (>3 layers from any detected peak):
| Condition | Mean separation reduction |
|---|---|
| CAZ peak layers | 0.503 |
| Non-CAZ layers (>3 layers from any detected peak) | 0.140 |
| Ratio | 3.59× |
Table 8: Layer-position specificity across all 28 base models × 17 concepts.
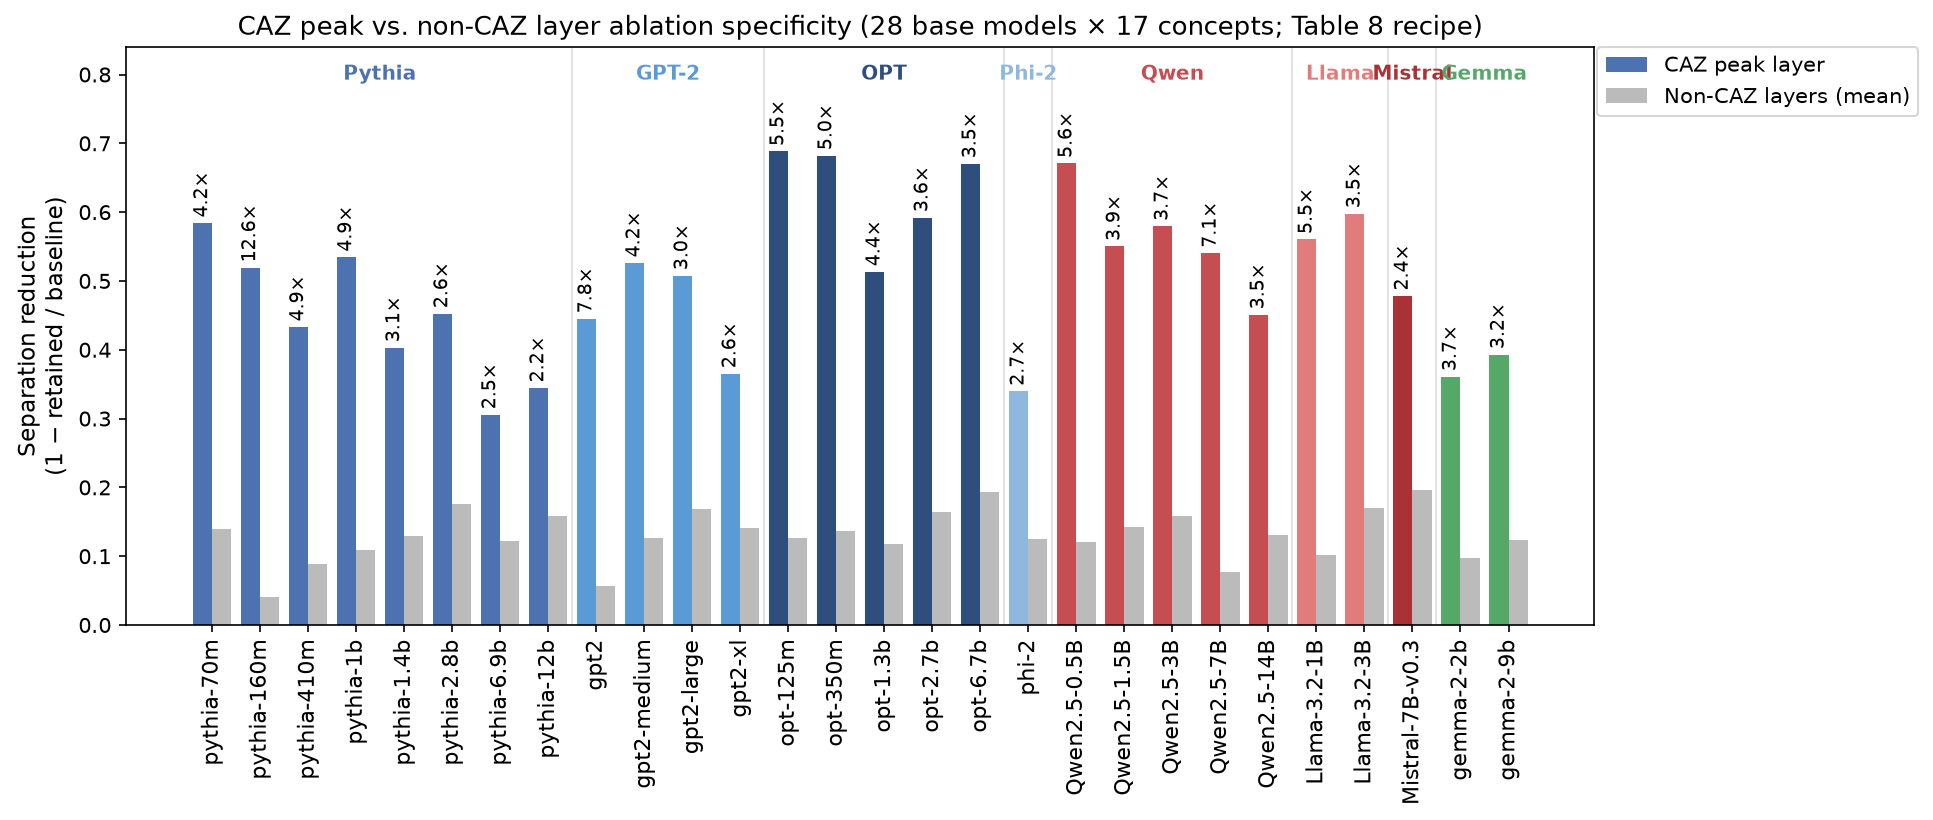
CAZ peaks produce 3.59× greater concept suppression than peak-distal layers (pooled means 0.503 vs 0.140; Mann-Whitney U = 2,772,013, p = \(1.58\times10^{-141}\); positive in every one of the 28 models, per-model 2.17×–12.56×). The per-model range is partly a comparator artifact: because the scored detector tiles the full depth, the peak-distal set (>3 layers from any peak) shrinks from ≈78% of a ≤12-layer model’s layers to ≈33% at 37+ layers, so a shallow model estimates its peak-distal baseline from a small, peak-distant sliver and reads an inflated ratio (pythia-160m 12.56×), while a deep model estimates it from a large, representative set (pythia-12b 2.17×). The effect’s robustness rests on its being positive at every depth — including the deep models where the comparator is largest and unambiguously peak-distant — not on the pooled magnitude or the depth-confounded mean-of-ratios (§H). Clustering the Table 8 statistic itself is a no-op, not a boost: a model-level bootstrap of the pooled ratio-of-means (resample the 28 models with replacement, 2,000 draws) recenters on 3.60× [3.28, 3.97], so within-model and within-family non-independence does not inflate the enrichment. A separate cluster bootstrap run on a simplified single-peak/peak-distal classification reads 4.29× [3.83, 4.84] (family-level 4.27×), but that is a different estimand — a mean-of-ratios that carries the shallow-model tail (§H) — not a more rigorous version of the 3.59×. The effect also survives depth-decile and direction-estimation-SNR covariate adjustment — the full robustness suite, the large-N p-value caveat, and the corrected-artifact provenance are in §H. Concept suppression is concentrated at the specific layers where a concept allocates, not a generic consequence of ablating anywhere.
CAZ peaks are direction-specific. Ablating 10 random unit vectors at the same peak layer suppresses almost nothing: the concept direction exceeds random by a median 606.6× (median z = 388.7), beats all 10 random seeds in 99.8% of pairs, and is consistent across cohorts (MHA 456.8×, GQA 1011.7×, Gemma 522.8×; full control and Figure S3 in §H).
Collateral-damage caveat. CAZ peaks are where and what to ablate for maximal suppression, but not the lowest-collateral site: KL divergence from the unablated next-token distribution is not lower at peaks than at peak-distal layers, and is higher in GQA/Gemma-2 (§8.7). Post-CAZ layers are superior on both axes (median separation efficiency 47.0 vs 32.2 at the peak, MHA) — peak ablation identifies causal structure; post-CAZ ablation is the cleaner-removal site on these measurements.
6.2 CAZ Dependency Structure
Directional ablation of 1,700 directed CAZ pairs across all 28 base models (C=17, N=250; 360 (model, concept) cells with ≥2 detected CAZes). For each eligible cell, all directed pairs are tested — one per ordered (upstream, downstream) combination, with upstream defined as the shallower-peaked CAZ. A downstream CAZ is classified as forward-dependent when ablating the upstream reduces its separation to ≤60% of unablated baseline; otherwise the pair is independent.
- 91.2% independent (1,550/1,700): Upstream ablation leaves downstream separation above 60% of baseline — the two assembly zones do not share causal load at detectable levels
- 8.8% forward-dependent (150/1,700): Upstream ablation reduces downstream to ≤60% baseline — shallow allocation gates deeper concept-specific assembly
- 0% backward or coupled (0/1,700): Not a single model, concept pair, or architecture family shows backward dependency
Forward-only information flow is expected from the residual stream architecture — each layer reads from and writes to a cumulative stream, so upstream perturbations propagate forward while downstream changes cannot reach already-computed layers. The 0% backward result confirms this, but is not the finding.
Denominator scope. The 1,700 directed pairs are the 850 unordered CAZ pairs counted in both directions, and the reverse direction (deeper CAZ ablated, shallower measured) is the one the residual stream forbids a priori. Half the denominator is therefore independent by construction, and the 91.2% independent rate should not be read as an empirical result about 1,700 free tests. Restricted to the 850 pairs where forward dependency is physically possible, the split at the same 60% cutoff is 82.4% independent / 17.6% forward-dependent (700/850 and 150/850). Both framings describe the same data — the first is a statement about directed pairs, the second about testable pairs — and the qualitative conclusion (independent majority, dependency a minority phenomenon) holds under either. The testable-pair (850) convention is the one this paper reports, in §6.5, §6.6 and the conclusion: it is the rate over tests that could actually have come out either way. The directed-pair figures are retained here and in the threshold sweep below for comparability with the earlier C=7 analyses, which used that convention.
Threshold sensitivity. The 60% retained-separation cutoff is a convention, not a calibrated boundary, so we report the split across the plausible range. Over 1,700 directed pairs: 95.6% independent at a 40% cutoff, 93.6% at 50%, 91.2% at 60%, 87.9% at 70%, 80.8% at 80% (forward-dependent 4.4%, 6.4%, 8.8%, 12.1%, 19.2% respectively; on the 850 testable pairs: 8.8%, 12.8%, 17.6%, 24.2%, 38.5%). The forward-dependent fraction rises monotonically with the cutoff, as it must — a looser criterion admits weaker effects — so the magnitude of the split is a function of where the line is drawn and the “8.8%” figure carries the 60% convention with it. Two things are invariant across the whole range: forward dependency remains the minority classification at every cutoff tested, and backward dependency is zero at every cutoff (0/850 at 40–80%), which is the architectural prediction holding under maximal permissiveness rather than at one hand-picked threshold.
The finding is the 82.4/17.6 split. The independent majority indicates that multi-CAZ concepts predominantly encode via parallel geometric sub-representations operating on distinct directions — consistent with the sub-representation model (Section 4.2). Forward dependency is a minority phenomenon (8.8% of directed pairs; 17.6% of testable pairs): a subset of shallow CAZes gate downstream concept-specific assembly hierarchically. The rate varies substantially by concept (formality: 20.1%; negation: 2.6%) and by architecture (OPT-6.7b: 34.2%; Mistral-7B-v0.3 and GPT-2-XL: 0.0%), indicating that hierarchical CAZ computation is concept- and architecture-specific rather than a general structural property.
6.3 Hierarchical Dependency
Major CAZes (high-score CAZes) feed downstream gentle CAZes asymmetrically:
- Deep gentle CAZes: Retained 30–80% of separation when the upstream major CAZ is ablated, varying by distance. Downstream dependents — this is the informative finding.
- Shallow gentle CAZes: Retained 100% of separation when the major CAZ is ablated (architecturally guaranteed — ablating a deeper layer cannot affect already-computed shallow representations). This serves as a consistency check, not an independence finding.
This is consistent with a computational hierarchy: shared shallow directions → major CAZ allocation → downstream gentle refinement. The independent shallow directions likely correspond to the shared cross-concept structure identified in Section 4.5 — though whether these represent discrete functional primitives or incomplete concept separation remains unresolved (§4.5).
6.4 Architecture-Conditioned Ablation and Patching
Projection ablation and activation patching together reveal that CAZ peaks play architecturally ordered causal roles. The GEM handoff protocol ablates at each node’s handoff layer (\(L_H = \min(L_\text{CAZ end} + 1,\, N-1)\), one layer after each CAZ segment boundary; a “node” here is one GEM — the trajectory record of one CAZ segment ([Henry, 2026b] §3.1) — and a multi-node concept, i.e. a multi-GEM atlas, is ablated at all of its handoffs at once) using the centroid-difference direction there — the assembled representation rather than the in-progress assembly at the Fisher peak; §6.5 validates the protocol. Running ablation at the handoff layer and patching at the identified CAZ peak across all 28 base models:
| Model cohort | GEM handoff ablation (sep. reduction) | Patching — raw (recovery) | Patching — trimmed (>1.0 removed) | Observed causal role |
|---|---|---|---|---|
| MHA cohort (Pythia, GPT-2, OPT, Phi-2) | 0.588 (n = 306) | 0.672 (n = 306) | 0.533 (16% overshoot rate) | Causally active at the peak; comparable to GQA |
| GQA+SwiGLU cohort (Qwen, Llama-3.2, Mistral) | 0.625 (n = 136) | 0.770 (n = 136) | 0.693 (13% overshoot rate) | Causally active at the peak; comparable ablation, somewhat stronger patching recovery |
| Gemma-2 (alternating local/global) | 0.367 (n = 34) at peak; ~1.0 at final global layer (§F, Table S3) | 0.685 (n = 34) at peak | 0.648 (9% overshoot) | Functional allocation at final global attention layer, not Fisher peak (n = 2 models) |
Table 9: Ablation and patching by model cohort, base models only, all 17 concepts. Projection ablation uses the GEM handoff protocol (§6.5); patching is single-layer injection at the CAZ peak. Raw patching means are inflated by overshoot (recovery > 1.0); the trimmed column removes those. At C=17 the MHA and GQA cohorts are comparable on ablation (0.588 vs 0.625, MHA marginally lower); the larger 7-concept-subset gap does not persist and we claim no cohort ranking. The MHA mean is computed over unclipped per-cell reductions: 22 of 306 MHA cells show ablation increasing* separation (retained 100–503% of baseline, reflecting downstream re-derivation under multimodal allocation, §4.2), contributing negative reductions, so the cohort mean is not a clip-at-zero average (a truncated-at-zero mean would read 0.658). Gemma-2 (n = 2 case study) is markedly weaker at the Fisher peak (0.367), with near-complete recovery at its final global attention layer (§F, Table S3). Per-cohort detail, the held-out endogeneity check, and the overshoot analysis are in §F; cohort values re-verified on corrected artifacts (MHA patching count corrected 323→306, ablation columns reproduce to ±0.001).*
The load-bearing point is that both cohorts are strongly causally active, not their ranking. MHA and GQA are both strongly causally active at the detected peak (0.588 vs 0.625, MHA marginally lower) and injection-responsive (patching restores separation); neither is privileged. Held-out evaluation on unseen pairs confirms injection-responsiveness with the endogeneity inflation at ≈22 pp (§F). Gemma-2 is the one cohort where the Fisher peak is not the functional site: ablating it has a markedly weaker effect (0.367 mean separation reduction, vs 0.588/0.625 for MHA/GQA), but patching at the final global attention layer recovers the concept near-completely (≈1.0 across 7 concepts × 2 sizes; §F, Table S3) — an n = 2 case study whose generalisation is follow-up.
The geometric peak is not the causal peak. Across 358 multimodal cases, the geometrically dominant CAZ is not the most causally active region in 50.3% of cases; when they diverge the causal peak is deeper 94.4% of the time. (We report the direction and rate but not a mean depth gap: that magnitude is definition-sensitive and did not survive re-derivation — see §8.7.) This sits significantly below a 57.9% permutation-null divergence rate (z = −3.02, p = 0.0016), so CAZ score carries real information about the causal region while still missing it in roughly half of multimodal cases — a systematic property of score-based selection, not noise (per-concept split rates and the null calibration in §F). This is the peak-selection limit synthesised in §6.6: no single fixed layer — short of the model’s own final one — reliably captures that causal structure alone, whether as a site to read a concept off or to intervene on it.
Overshoot caveat. Several small MHA models show patching recovery > 1.0 (opt-125m 1.150; pythia-70m 1.024) — the injection overrides rather than restores natural computation, so recovery measures how effectively an artificial signal biases geometry, not the fidelity of the model’s own computation. This qualifies the “restoration” reading of the patching numbers throughout (full analysis in §F).
6.5 Zone-Level Ablation Validation
A structural critique of the CAZ framework is that it characterizes assembly zones but validates causal claims via single-layer ablation — testing a trajectory theory with point interventions. To address this, we ran a zone-level ablation protocol (GEM — Geometric Evolution Map): track the concept eigenvector through each CAZ zone, capture the settled direction at each zone’s exit layer, and ablate it at the node’s handoff layer (segment exit + 1). This targets the assembled product rather than the assembly process in progress.
Phase 1 (handoff vs. peak ablation): Across Pythia-1.4b and GPT-2-XL × 17 concepts (C=17), handoff ablation outperforms single-layer peak ablation in all 34 cases, extending the original C=7 result (13/14). (In the pre-correction corpus this read 33/34, the sole exception being a GPT-2-XL exfiltration case whose near-tie was an artifact of the corrupted exfiltration labels; §D.) GPT-2-XL negation illustrates the gap: peak-layer ablation retains 59% of baseline separation; handoff ablation retains 31% — the assembled product at the handoff layer is more causally active than the in-progress representation at the assembly peak.
Full-corpus extension (26 models × 17 concepts): Across 442 model-concept pairs (17 MHA, 7 GQA, and 2 Gemma models — this extension predates the two 2026-07-03 roster additions and has not been re-run on them), geometric handoff advantage holds in 304/442 cases (68.8% overall): MHA 73.7% (213/289 pairs), GQA 63.9% (76/119), Gemma 44.1% (15/34). The GQA result (63.9%) confirms the protocol generalises beyond MHA. These 442 cells are a nested subset of the 493 the companion GEM paper reports (341/493, 69.2%), read from the same stored ablation artifacts — a roster-robustness view of one computation, not an independent test ([Henry, 2026b] §5.1). Gemma’s near-chance result is expected — alternating local/global attention localises functional allocation at the final global layer (§6.4) regardless of where the Fisher peak falls, so neither handoff nor peak ablation targets the true functional site in that cohort.
Phase 2 (handoff-width sensitivity) — the sensitivity of the protocol to the ablation window width — is characterised in the companion GEM paper [Henry, 2026b] §5.2. Phase 3 (cascade propagation): The adaptive window-width rule extending this protocol to near-final-layer handoffs (w=1 when \(L_H/N\) > 0.85; w=3 otherwise) is reported in [Henry, 2026b] §5.2. For dependent concept chains (17.6% of testable CAZ pairs at C=17, §6.2), ablating only the upstream handoff propagated automatically to 100% of dependent downstream nodes in both MHA pilot models (7/7 Pythia-1.4b dependent nodes, 11/11 GPT-2-XL). GQA cascade propagation was partial — 43% of downstream nodes in Qwen 2.5 — consistent with downstream layers re-deriving the concept via alternative routes (§6.4).
On this evidence — strongest in the MHA cohort, chance-level in Gemma — zone detection is more than a geometric description of where peaks happen to occur: each node’s handoff layer is causally more effective than its assembly peak. We had read this as the handoff holding the settled output of the assembly event; a site-matched depth control (§8.7) shows the advantage is attributable to the handoff’s greater depth rather than to settling per se, so that stronger inference is withdrawn while the descriptive handoff-vs-peak advantage stands. Full GEM methodology is described in a companion paper [Henry, 2026b].
6.6 Interim Synthesis: Validated Geometric Causality, and the Peak-Selection Limit
This synthesizes §§6.1–6.5 (plus §6.8’s behavioral pilot, referenced ahead of its own subsection below); §6.7’s CKA/coasting analysis and §6.9’s Gemma-2 case study follow as further evidence, not additional throughline claims — the full-section synthesis is §8.
Sections 6.1 through 6.4 each report a different manifestation of the same underlying finding.
Section 6.1: gentle CAZes — features whose Fisher separation prominence is barely visible above the noise floor — remain causally potent: they cross the 20pp suppression threshold nearly as often as high-score major CAZes (98% vs. 97%), though their average suppression magnitude is lower (63.2pp vs. 70.7pp). CAZ score predicts how geometrically organized a feature is; it does not strongly predict how much of the concept it carries.
Section 6.2–6.3: within-concept CAZ dependency follows a strict forward-only pattern (82.4% independent, 17.6% forward-dependent at C=17 across the 850 testable pairs; zero backward dependencies, as expected from the residual stream’s forward-only information flow — which is also why the architecturally-excluded reverse direction is kept out of the denominator). The independent majority indicates most sub-representations operate on different geometric directions; the forward-dependent minority reveals hierarchical computation — shared shallow allocations feeding downstream gentle refinement.
Section 6.4: CAZ peaks are valid injection sites for all architectures and are causally active under ablation across them (MHA 0.588, GQA 0.625 — comparable; Gemma 0.367, which localizes at its final global layer). Within multimodal concepts, the geometrically dominant peak is not the argmin-self-retained region in 50.3% of cases; when the two diverge, that region is the deeper one 94.4% of the time (the mean depth gap is definition-sensitive and is not reported, §8.7). None of the cohorts reaches 1.0 at a single CAZ — a single CAZ ablation identifies a causally-active site but is insufficient for complete concept removal because concepts are multimodally allocated (§4.2); complete removal is a multi-CAZ protocol problem. What the depth-structured divergence between the geometric peak and the most-ablation-sensitive region reflects is left to dedicated follow-up.
What the framework validates: scored CAZ detection identifies layers carrying measurable, direction-specific concept signal, and ablation confirms they are causally active (§6.1) — the constructs are real and predictive.
What the data additionally show, as a measurement rather than an interpretation: the single highest-Fisher-separation layer is not always the most ablation-sensitive among a concept’s multiple peaks (§6.4), and that ablation ranking is depth-structured. Whether geometric prominence can serve as a proxy for ablation impact — and what the divergence between them means mechanistically — is a question this validation surfaces but does not answer; it is dedicated follow-up, for which the framework supplies the detection and ablation infrastructure.
The throughline, extending to §6.5 and §6.8: causal structure is real, but no single layer is reliably where to find or act on it. The dominant geometric peak misses the most ablation-sensitive region in 50.3% of multimodal cases (§6.4). The handoff layer — GEM’s reproducible readout site, not its answer to which single layer to use — beats the peak in 68.8% of cases, an improvement but not a resolution: picking it still gives the wrong answer roughly a third of the time (§6.5), and the depth-matched control shows that advantage is about depth, not about the handoff boundary being privileged (§8.7).
Neither peak nor handoff shows a reliable behavioral advantage over a matched control (§6.8). This is the same conclusion the companion GEM paper reaches from its own instruments: no single, rotation-blind layer choice reliably recovers a concept’s settled direction ([Henry, 2026b] §5.1–§5.6). What both papers converge on is that a concept’s geometric encoding must be tracked across depth, not read off at one chosen point — CAZ’s and GEM’s actual contribution, independent of whether any one layer within that structure turns out to be special.
Scope, restated. Per the §6 scope note: every “causal” finding in this section is operationalized as ablation-measured separation reduction or patching-measured recovery — both geometric measurements at the model’s final-layer concept direction. The KL divergence data referenced in §2.5 offers a partial bridge toward prediction-level effects (post-CAZ efficiency holds on both separation and KL, §8.3), but we do not demonstrate that CAZ ablation changes next-token probabilities, task performance, or generation behavior.
The behavioral pilot in §6.8 partially addresses this gap: direction-specific suppression is confirmed across 27 of the 28 base models (random-direction ablation ≈ 0 in every cohort; §6.8). Peak advantage over a matched peak-distal control is not statistically established at 3 probes per concept (pooled probe rate 49.4%, exact binomial p = 0.69; §6.8). Broader behavioral validation — task accuracy, zone-level behavioral ablation — remains follow-up work.
The post-CAZ efficiency advantage noted above is not specific to the geometric metric: post-CAZ ablation achieves median separation efficiency 47.0 versus 32.2 at the CAZ peak (MHA; §6.1), and KL divergence from the unablated next-token distribution is not lower at CAZ peaks than at post-CAZ layers (§8.7) — so post-CAZ layers support the most targeted intervention by both geometric and prediction-level measures.
6.7 CKA Boundaries and Coasting Regions
The following analysis is exploratory — its original hypothesis is unresolved rather than confirmed or reversed (below), and the reported effects are small.
Two questions the Fisher/velocity framework leaves open: (1) how far does a CAZ region actually extend, and (2) what is happening at a region’s peak-distal layers? We address both using linear Centered Kernel Alignment (CKA; Kornblith et al., 2019), applied to adjacent transformer layers across the 26-model CKA corpus — the CKA sweep predates the pythia-12b and Qwen2.5-14B roster additions and was not re-run on them (Table 1).
CKA does not separate within-region from cross-boundary pairs. CKA between adjacent layers measures representational stability: high CKA = layers are similar (little transformation), low CKA = active transformation. We initially hypothesized that within-region adjacent pairs would show higher CKA than pairs straddling a region boundary — if CAZ regions are coherent assembly units, they should be internally similar. This hypothesis was not in the CAZ Framework [Henry, 2026a]; it was formed post-hoc when the CKA profiles became available. We report no reliable difference in either direction. The originally reported contrast (within-region 0.962 vs. cross-boundary 0.977, one-sided Mann-Whitney p = 0.07, d = \(-0.163\)) was already non-significant, and it does not survive re-derivation: under per-pair pooling the same data give 0.958 vs. 0.931 and under per-cell pooling 0.940 vs. 0.930 — both in the opposite direction. No canonical pooling convention we tried reproduces the published ordering, so the sign of this comparison is an artifact of aggregation choice rather than a finding. The supportable statement is that within-region and cross-boundary adjacent-layer CKA are indistinguishable at this resolution; we withdraw the earlier “reversal” reading and the velocity-based rationalization offered for it (see §8.7).
Separately from that comparison, a detrended-dip analysis suggests CKA may serve as a refiner of CAZ extent rather than a validator of Fisher boundaries. Detrending the CKA curve to remove its monotonic increase with depth and finding contiguous dips around each Fisher peak yields CKA-derived CAZ extents with mean width 1.4 layers, compared to 5.7 layers under Fisher region boundaries. Fisher boundaries are conservative — they capture the full region of above-baseline velocity. CKA dips suggest narrower assembly windows. The Fisher peak locates where assembly occurs; the CKA dip suggests how long it lasts.
Coasting regions. By CKA labeling, ~82% of model depth is classified as coasting — high-CKA, flat-separation plateaus at peak-distal layers (81.6% pooled over the 26-model CKA corpus, 78.8% as a per-model-concept mean, at the default 0.003 detrend threshold. The earlier figure of 75.6% was an erroneous transcription of the pre-correction multimodal rate 360/476 — no CKA-derived threshold reproduces it, and the corrected coasting fraction is stable at 78–81% (per-model-concept mean) across detrend thresholds 0.001–0.02). High CKA and flat separation indicate the representation is not actively transforming in these regions, but what functional role they play beyond passive persistence — whether the residual stream is actively maintaining a stably-assembled concept representation, or something else — is not established by current metrics (Fisher separation, velocity). Coasting is the CKA-operationalized analogue of “peak-distal”: every coasting layer still belongs to some CAZ region, major or gentle alike, since the scored detector tiles the full depth (§6.1) — not a third category outside CAZ structure, but a distinct structural element within it, and one that warrants further characterization as open follow-up work.
Late coasting regions as GQA injection sites. §6.4 shows GQA peak ablation comparable to MHA (0.625 vs 0.588) with somewhat higher patching recovery (0.770 vs 0.672) — peak-injection works across cohorts. Across Qwen models, the late coasting region — the stable plateau in the final 10–20% of model depth — consistently achieves near-complete or complete recovery regardless of where the Fisher peak sits or what recovery that peak yields:
| Model | Concept | Fisher peak | Peak recovery | Coasting layer | Coasting recovery |
|---|---|---|---|---|---|
| Qwen2.5-3B | negation | L0 (0%) | 0.037 | L33/36 | 1.046 |
| Qwen2.5-7B | negation | L0 (0%) | 0.011 | L24/28 | 1.013 |
| Qwen2.5-3B | credibility | L27 (75%) | 0.904 | L33/36 | 1.001 |
| Qwen2.5-7B | temporal_order | L20 (71%) | 0.773 | L25/28 | 0.983 |
| Qwen2.5-1.5B | causation | L17 (61%) | 0.766 | L25/28 | 0.990 |
Table 10: Patching recovery at Fisher peak vs. late coasting region for selected GQA models (non-final layers only; last 2 layers excluded to rule out trivial output injection). N=250 corpus.
Two patterns are visible. For negation, Fisher detection identifies an embedding-layer peak (L0, 0% depth; §3.3) with near-zero patching recovery (0.011–0.037), while the late coasting region achieves overshoot-level recovery (1.013–1.046). For credibility, temporal_order, and causation, Fisher peaks are mid-to-late (61–75% depth) with moderate recovery (0.77–0.90); the late coasting layer adds a meaningful increment to ≈1.0. In both cases the late coasting region achieves near-complete recovery while the Fisher peak does not — consistent with the concept direction having reached its causally-active stable form by the coasting region, though these late layers sit at 88–92% depth where patching recovery is near-complete corpus-wide regardless of coasting status (§8.3), so readout proximity is an alternative reading this table does not exclude.
The Gemma-2 functional allocation layer identified in §6.4 is a specific instance of this pattern: the final global attention layer is the last stable coasting point before the LM head, and achieves near-complete patching recovery across all concepts. The Qwen results show the same causal structure applies to GQA models without Gemma’s architectural forcing. The recovery differential — near-zero at the Fisher peak for negation, ≈1.0 at coasting; moderate at mid-late Fisher peaks for compositional concepts, ≈1.0 at coasting — indicates that single-layer patching recovers the concept most completely at the coasting region rather than at the Fisher peak. What that recovery pattern implies mechanistically is left to dedicated follow-up (§6.6).
6.8 Behavioral Pilot: Logit-Difference Suppression at CAZ Peak
This pilot is a direction-specificity proof-of-concept, not a behavioral benchmark: it asks whether the CAZ-peak concept direction is functionally active on next-token predictions — which it decisively confirms (27/28 models positive, random-direction ablation ≈ 0) — and is deliberately not powered to resolve the finer peak-vs-midpoint-control question, which at 3 probes per concept returns chance (49.4%, p = 0.69) and needs multi-sentence prompt suites (≥10–15 per concept) because a concept persists across many layers so any single layer carries partial signal (§8.7). Read the two results in that light: the coarse claim (the direction is causal) is established; the fine claim (the peak beats a matched-depth control) is left to a properly powered follow-up.
Design. For each of the 28 base models × 17 concepts, we measure whether ablating the concept direction at the CAZ peak layer suppresses concept-diagnostic next-token predictions more than the same ablation applied at a matched peak-distal control layer (peak-distal layer closest to model midpoint, same concept direction) or a random direction at the CAZ peak.
Metric: \(\text{suppression} = \text{logit\_diff}(\text{baseline}) - \text{logit\_diff}(\text{ablated})\), where \(\text{logit\_diff} = \log p(\text{pos\_token}) - \log p(\text{neg\_token})\) across 3 concept-diagnostic probe sentences per concept (51 probes per model; 1,428 pooled across all 28 models). Prediction: \(\text{suppression}(\text{peak}) \gg \text{suppression}(\text{control}) \approx \text{suppression}(\text{random})\).
Results. The full-corpus pilot produces two distinct signals.
Direction specificity — confirmed across the corpus (27/28 models positive). Random-direction ablation at the CAZ peak layer produces near-zero suppression in all architecture cohorts (mean rand = −0.005 pooled; MHA: −0.005, GQA: −0.008, Gemma: +0.013). Mean concept-direction peak suppression is positive in 27/28 models (mean MHA +0.43, GQA +0.33, Gemma +0.92 — Gemma’s is the largest cohort mean but rests on n=2 models with an unreliable single-direction readout (§6.9) and should be read as a small-sample figure). Ablating the concept direction at the CAZ peak suppresses concept-diagnostic predictions substantially more than ablating a random unit vector — direction specificity is confirmed at scale.
Peak vs. matched control — not established at probe level. At 3 probes per concept-model pair, the pooled probe-level result is 706/1,428 = 49.4% (peak wins ctrl; exact binomial p = 0.69 — indistinguishable from chance). Model-level analysis (proportion of individual probes per model where peak wins) shows 16/28 models directionally positive but is not significant (exact binomial p = 0.57). The pilot is underpowered to establish peak direction-specificity over a midpoint control at 3 probes per concept. The claim that peak ablation outperforms a midpoint control is not supported at this sample size and probe count.
| Cohort | Models | Probe rate | Mean peak supp | Mean rand supp |
|---|---|---|---|---|
| MHA | 18 | 448/918 = 48.8% | +0.43 | −0.005 |
| GQA | 8 | 203/408 = 49.8% | +0.33 | −0.008 |
| Gemma | 2 | 55/102 = 53.9% | +0.92 | +0.013 |
| Pooled | 28 | 706/1,428 = 49.4% | +0.42 | −0.005 |
Table 11: Full behavioral pilot results across all 28 base models, 17 concepts, 3 probes/concept (1,428 total probes). “Probe rate” = fraction of individual probes where peak ablation suppresses more than midpoint control. Pooled probe rate 49.4% is not significantly different from 50% (exact binomial p = 0.69). Direction specificity (rand ≈ 0, peak > 0 in 27/28 models) is confirmed in all cohorts.
Interpretation. The direction-specificity result confirms that geometric measurements inside the residual stream reflect genuine direction-dependent functional structure: random directions at CAZ peak layers do not suppress concept-diagnostic predictions. This is the load-bearing result of §6.8.
The non-significant peak-vs-control result reflects a fundamental constraint of single-layer behavioral testing, the same limitation flagged in §8.7 for all geometric ablation experiments: concept directions persist across many layers (§6.2), so any single layer — peak or midpoint control — carries partial concept signal. The midpoint control is not a “non-causal” baseline; it is a layer with real but sub-maximal concept sensitivity. At 3 probes per concept, the pilot is underpowered to resolve this distinction. A minimum of 10–15 sentences per concept is required before per-concept or aggregate peak-vs-control conclusions are reliable.
The GEM framework [Henry, 2026b] addresses this in the geometric domain not by ablating across the full CAZ window — GEM’s reported ablations remain single-layer, at the handoff point (§8.7) — but by tracking the concept’s trajectory across the window and ablating at the layer immediately past CAZ’s own zone boundary — the handoff layer — rather than at the CAZ peak; the 29-model GEM sweep ([Henry, 2026b]) demonstrates the resulting suppression (§6.4–6.5). The appropriate behavioral analog — zone-level logit-difference suppression across the full CAZ window compared to a zone-matched peak-distal window — is the correct follow-up test, and remains open: it has not been run. The present pilot establishes that the concept direction is functionally active at the CAZ peak layer (direction specificity confirmed); it was not designed to test the full zone-level claim.
This single-point fragility is not specific to our pipeline: in a clinical-triage evaluation, linear probes decoded hazard-vs-benign cases from a model’s internal activations at 98.2% AUROC, yet four single-layer steering methods (concept bottleneck, SAE feature, logit-lens patching, and a truthfulness separator vector) corrected at most a quarter of the model’s behavioral errors, and one had zero effect despite acting on thousands of significant features (Basu et al., 2026). Near-perfect decodability at a point in the network does not guarantee that a point intervention can act there — the same peak-vs-causal-region gap this paper documents (§6.4).
6.9 Gemma-2: Distributed Concept Encoding — a Case Study in Readout Failure
Sections 3.1–3.2 report the Gemma-2 cohort’s concept orderings as not reliably estimated at N=250: the two models have the least reliable orderings in the corpus (split-half τ = 0.176/0.184 vs. a corpus median of 0.717), and their dominant directions do not reproduce across independent pair draws: peak-layer split-half cosine 0.62–0.90 (median 0.73) against ≥0.96 for GPT-2 and Qwen2.5-3B controls at the same statistic. The gap is robust to how layers are aggregated (best-layer 0.73 vs. 0.97 control; layer-averaged ≈0.66 vs. 0.97) and persists at every sample size tested from 125 to ~1,400 pairs, with extraction itself bit-deterministic. This section characterises that failure. The characterisation changes its meaning: Gemma-2’s concept information is fully present and stable — what fails is specifically the single-direction point estimate this framework (and the contrastive-direction lineage generally, §8.4) uses as its geometric readout.
The information is intact. A logistic probe trained on one half of the calibration pairs and evaluated on the disjoint half classifies gemma-2-2b’s held-out activations at 0.89–0.999 AUC (median 0.974 across eight concepts) — statistically indistinguishable from the GPT-2 control (0.98–1.00) — from the same activations whose difference-of-means direction reproduces at only 0.62–0.90 across those halves. The unstable direction itself is not wrong, merely underdetermined: each draw’s DOM classifies the other half’s pairs at 0.82–0.99 AUC. Every estimate is a valid concept direction; independent estimates are simply different valid directions.
What “distributed” means quantitatively. The spectrum of per-pair difference vectors at the peak layer separates the two regimes. GPT-2 concentrates pair contrasts onto a few shared axes (leading component carries 23–56% of the energy; participation ratio 3–14). Gemma-2-2b spreads the same contrasts across many directions (leading component 6–20%; participation ratio 20–78). The shared concept axis is a far smaller fraction of per-example representational variance — precisely the regime in which a mean-difference estimator is sample-starved. Empirical convergence curves agree quantitatively: fitting split-half agreement as \(\cos(n) = 1/(1+c/n)\) per concept over the archived rcp_v1 pool (~850–1,440 pairs per concept) gives median \(c \approx 49\) for gemma-2-2b against 3.3 for the GPT-2 control — a ~15× larger pair budget for equal direction stability — with 11 of 17 concepts predicted, on the fitted curve, to reach corpus-grade stability (0.95) within the existing pool (an extrapolation of the fit, not an observed N=2000 run) and the slow tail (deception, agency, authorization, threat_severity) requiring ~1,272–1,486 pairs (\(n_{95} \approx 19c\); exfiltration is nominally the slowest at \(n_{95} \approx 2,084\) but is set aside here because its rcp_v1 pool predates the label correction of §D). A fresh-extraction pilot fit the same curves more pessimistically (median \(c \approx 81\); its raw data was not retained), so per-concept pair budgets should be read as order-of-magnitude estimates; the two measurements agree on the 15–20× gap and on which concepts form the slow tail.
Gemma-2’s failure is not architectural in any way we could ablate, and not reducible to an estimator artifact. Robust estimators (per-dimension median, 20%-trimmed mean) make stability worse on 17/17 concepts — the signature of broad-spectrum sampling noise, not outlier contamination. Disabling attention-logit softcapping changes split-half stability by ≤0.0008 (it is a de-facto no-op at this corpus’s activation scales); the pre+post RMSNorm sandwich cannot be cleanly ablated (removal degrades stable and unstable concepts alike); precision, attention implementation, and library version are all ruled out; and the instability is already present at the raw token-embedding layer (layer-0 split-half agreement ≤0.53 on every tested concept, where GPT-2 exceeds 0.85 on most), before any transformer block runs. Subspace-regularised estimators do not help either: projecting each half’s DOM onto its own top-k difference subspace (k = 5–40) leaves cross-half agreement unchanged, so the instability is not a rotation within a small stable subspace. A covariance-aware estimator is the one remedy that partially helps — and it is the natural test if the instability were an anisotropy artifact rather than genuine distribution, since the difference-of-means ignores within-class covariance while a logistic probe implicitly whitens it away. Ledoit-Wolf whitening of the activations before taking the mean difference raises gemma-2-2b’s split-half agreement from 0.75 to 0.87, recovering roughly half the gap to the 0.97 control. But it does not close it — 0.87 is still far below control, and this is an upper bound (the whitening transform is shared across halves) — and the anisotropy account fails a direct check: Gemma-2’s centred activation covariance is flatter than the controls’, not sharper (leading-eigenvalue share 0.12 vs. GPT-2’s 0.19), the opposite of what a “massive-activation anisotropy breaks the mean-difference” explanation requires. Covariance-blindness is therefore a partial contributor, not the cause; the residual instability is genuine high-dimensional structure, and at N=250 more pairs remain necessary for full recovery.
The erasure asymmetry, and what it retracts. The operational consequence is sharpest in an erasure test: estimate a concept payload on half the pairs, project it out of both halves, and measure whether the concept remains decodable from the held-out half. On GPT-2, removing the single DOM direction collapses held-out decodability from 0.995 to 0.64 — this is why single-direction ablation works throughout this paper. On gemma-2-2b, removing the single direction changes nothing (0.948 → 0.95): the concept is exactly as decodable after the ablation as before it. A rank-20–40 difference-subspace payload — still only ~1.7% of the 2304-dimensional space, and estimable at N=250 because the span transfers across halves even though no individual direction does — achieves on Gemma what rank-1 achieves on GPT-2 (held-out AUC 0.56–0.60). This finding retroactively rescopes the Gemma-2 rows of §6.4–§6.5: chance-level handoff-vs-peak results (15/34) and weak Fisher-peak ablation (0.367) are what single-direction intervention must produce on a distributed code regardless of the underlying causal structure, so those cells are uninformative about Gemma rather than evidence of causal inertness. The functional-allocation finding (§6.4, §8.3) is unaffected: activation patching moves whole residual vectors and requires no direction estimate, and its near-complete recovery at the final global attention layer (Table S3) stands.
A four-readout dissociation. The same activations, four readouts:
| Readout | Operates on | Gemma-2 result |
|---|---|---|
| Linear probe (information-level) | full activation space | works (0.89–0.999 held-out AUC) |
| Activation patching (functional) | whole residual vectors | works (recovery ≈ 1.0, Table S3) |
| Single-direction geometric (DOM/CAZ/GEM payload) | one estimated axis | fails (peak-layer reproducibility 0.62–0.90 vs. ≥0.96 controls; rank-1 erasure inert) |
| Trajectory shape (depth ranking of rotation) | where the axis rotates vs. sits settled across depth | works (reproduces across draws at Spearman 0.94; GPT-2 0.98) |
The fourth row is the one that needs elaboration: the shape of the direction’s trajectory through depth — where it rotates rapidly versus sits settled — reproduces across draws at Spearman 0.94 (GPT-2: 0.98), because within a single draw the sampling noise is shared across layers and cancels from layer-to-layer comparisons. Assembly-zone locations for Gemma are therefore meaningful even where the settled directions are not (node placement carries ±2–3 layers of draw noise, and layer-to-layer cosine magnitudes are biased upward by the shared noise; the depth ranking of rotation is the trustworthy quantity).
What this is not. It is not the extreme of the GQA/distributed-profile continuum documented in §8.3. Across 24 models, split-half ordering reliability shows no significant correlation with the geometric score profile (ρ = −0.25 vs. mean CAZ score, p = 0.24, underpowered at n = 24), and the counterexample is decisive: Qwen2.5-3B has the lowest mean region score in the corpus (0.185 — the most “distributed-looking” profile) and the highest ordering reliability (0.992). Low geometric prominence and point-estimate instability are different axes; the Gemma-2 pair is alone on the second one.
Nor is it the training objective. The natural candidate — gemma-2-2b and -9b are distillation-trained, and matching a teacher’s full output distribution plausibly rewards richer per-example encodings — was tested twice and refuted twice. distilgpt2, pure-distilled from GPT-2, shows no trace of the signature (split-half 0.978–0.993, participation ratio 3–11, rank-1 erasure fully effective). Decisively, gemma-2-27b — trained from scratch on the identical architecture — is exactly as unstable as its distilled siblings (best-layer split-half 0.729 vs. 0.727 for gemma-2-9b-it and 0.725 for gemma-2-2b at the matched statistic, against 0.965 for the GPT-2 control; the -it result additionally exonerates RLHF).
What remains, for Gemma-2 specifically: the instability is a family-level property that survives every single-component account tested — not the objective, not softcapping, not the norm sandwich in any interpretable way, not precision or environment, and only partially the estimator (a covariance-aware estimator recovers about half the gap, not the whole, and the controls are more anisotropic, not less). What remains is the family’s shared substrate — data recipe, the 256k tied embedding table (the one candidate positively supported by the layer-0 onset of the instability), or an interaction of components that no single inference-time ablation isolates. We leave the cause open and note that inference-time ablation as a tool is exhausted here; discriminating the remaining candidates requires either training-side intervention or a non-Gemma model sharing the candidate component.
A newer Gemma generation bounds the property’s scope. One further datapoint — outside the Gemma-2 cohort this section is otherwise about — helps calibrate how far to generalise: a split-half diagnostic on the newer Gemma-4-26B-A4B (a different generation, mixture-of-experts; extended-corpus member, §5.3) lands at 0.833 — intermediate between the Gemma-2 cohort (0.62–0.73) and the ≥0.96 controls, with the same concept-dependence (formality 0.955, credibility 0.923 stable; deception, negation, moral valence in the 0.77–0.78 unstable band). The Gemma lineage is therefore partially shedding the instability across generations, which argues for an engineerable substrate feature rather than a fixed family constant — and, concretely, cautions against extrapolating this section’s Gemma-2 findings to frontier models as a class, since the newest Gemma is already measurably less affected.
For this paper’s results, the Gemma-2 rows are retained wherever they appear, carrying the §3.2 caveat; the honest summary is that Gemma-2 is a hard case for the instrument, not a silent failure of the framework — the convergence fit points to a pair-budget condition under which the family would plausibly become measurable (\(n_{95} \approx 19c\) pairs per concept, i.e. ~1,272–1,486 for the noisy tail — an extrapolation of the fit, not an observed run). Practical deployments of contrastive-direction methods calibrate on thousands of pairs as a matter of course, so the fit points toward a calibration-budget explanation — plausibly recoverable at higher N rather than a fundamental illegibility — though at this study’s frozen N=250 it remains a real limit, and we prefer reporting it as such over quietly excluding the family.
7. Dark Matter
The problem.
Seventeen concept probes — credibility, negation, causation, temporal_order, sentiment, certainty, moral_valence, specificity, plurality, agency, formality, threat_severity, authorization, urgency, sarcasm, deception, exfiltration — are the lens through which every result in this paper is obtained. But the residual stream of a transformer does not exist to serve seventeen concepts. At every layer, the model maintains a high-dimensional state vector that encodes everything it needs to predict the next token: syntax, semantics, pragmatics, world knowledge, discourse structure, and computational intermediates that may not correspond to any human-legible concept at all. Our seventeen probes cover a small fraction of this space. This section reports what we find when we look beyond them.
Across all 28 base models, unsupervised eigenvalue decomposition (Marchenko–Pastur threshold on between-class covariance) identifies 700 geometrically organized activation features (persistent directions, 5+ layer lifespan) — persistent directions that exceed the random-matrix-theory bound and are actively maintained across multiple layers (636 from the 26 base-cohort models; pythia-12b contributes 29, Qwen2.5-14B contributes 35). A persistent feature counts as concept-labeled if a concept match (|cosine| \(\geq\) 0.5 against the concept’s dominant-direction vector) is recorded at more than half of the feature’s tracked layers, not merely at any single layer. Under this criterion, the full C=17 concept set labels 60 of 700 persistent features (~8.6%); the remaining ~91.4% are dark matter: real geometry, unknown function. This is not a saturation ceiling — the seventeen probes tested here are themselves a small fraction of everything the residual stream encodes, and more concept probes would be expected to recover more of the organized activation geometry. However, the persistent-feature count scales strongly with attention mechanism:
| Paradigm | Models | Mean persistent features/model | Range |
|---|---|---|---|
| MHA (Pythia, GPT-2, OPT, Phi-2) | 18 | 23.5 | 0–33 |
| GQA (Qwen, Llama, Mistral) | 8 | 29.8 | 12–43 |
| Alternating (Gemma-2) | 2 | 19.0 | 17–21 |
Table 12: Persistent spectral features (5+ layer lifespan) by attention paradigm, all 28 base models, N=250 deep-dive run (pythia-12b, Qwen2.5-14B added 2026-07-03).
Gemma-2’s alternating local/global attention yields 17–21 persistent features per model — lower than GQA but comparable to MHA at this scale. The count varies by attention paradigm (Table 12) — consistent with local attention limiting long-range feature coherence across the full depth of the model, though this is a plausible reading of a three-cohort correlation, not a directly tested mechanism. The term “dark matter” is descriptive, not an assertion of hidden meaning; whether the observed count variation is driven by architectural capacity to maintain persistent directions, by semantic content, or by some other cross-architecture confound is not established by this data alone.
Relay features — provisional candidates. Among the 636 persistent directions in the 26-model census (relay discovery depends on the same concept-direction data as the labeled/unlabeled split above, and has not been re-run on the two additions), 12 survive a candidate-discovery pipeline as relay features: persistent directions that align with one concept at shallow layers and a different concept at depth, surviving both an across-feature permutation null (observed 12 vs. null mean 4.1 ± 1.8, \(p = 0.001\) unadjusted, 1000 shuffles; see §8.7 for multiple-comparisons caveat) and single-feature ablation confirmation. Two methodological concerns — a dominant-variance confound in the top eigenvector of the dark-matter subspace, and a circularity in the allocation-order definition that prevents distinguishing relay from dominant-variance tracking — leave the count provisional. A lower-rank eigenvector check would resolve both concerns; this remains open follow-up work. The 12 candidates are reported here to complete the dark-matter accounting; they should not be cited as a counted result of this paper.
8. Discussion
8.1 What the Method Gets Right
Two distinct claims hold up here, not one. First, the pre-specified prediction that concept assembly follows a detectable ordering tendency across architectures (P2) survives stress-testing across 28 models and 17 concepts: 27 of 28 show positive rank correlation with the 17-concept mean ordering and one (gpt2-medium) sits at exactly zero (median \(\tau = 0.404\); W = 0 (sum-of-positive-ranks = 378 over 27 non-zero models), p = 1.49×10⁻⁸). Second, and independently of the scorecard, the detection method itself surfaced more than it was built to find: scored detection reveals richer structure than anticipated — concepts assemble multimodally at multiple depths (76.3% of model–concept pairs), with depth-separated sub-representations (shallow vs deep peaks) — and the gentle CAZ finding demonstrates that a substantial portion of ablation-sensitive geometry in transformer models operates below previous detection thresholds.
8.2 Where the Predictions Fall Short
P1 (mid-stream ablation optimal) was partially supported at region level but not at peak-selection level — within-CAZ is the modal optimal class (73.1%), with 21.6% of optima post-CAZ and 5.3% pre-CAZ. The measured reason: the composite-score-dominant CAZ is not the argmin-self-retained region in 50.3% of multimodal cases (§6.4), and the more-ablation-sensitive region is deeper. In both the MHA and GQA cohorts, peak ablation is causally active and comparable (0.588 vs 0.625 sep-reduction under the GEM handoff protocol) and patching recovery is high (0.672 and 0.770), so the CAZ peak is both ablation-sensitive and a valid injection site across architectures — the method’s causal claims hold; it is specifically the peak-selection prediction that does not. For Gemma-2, the empirically-recovered site is the final global attention layer (case study, §6.9). The interpretation of why peak-selection fails is follow-up, not settled here. P6 (lexical vs. compositional identity of sub-representations) was tested and failed (p = 0.82); indirect evidence supports the broader shallow/deep distinction but does not rescue the specific prediction. A different experimental approach is needed.
8.3 The Cohort Behavioral Difference
At the full 17-concept set, the 2019–2022 MHA and 2023–2025 GQA+SwiGLU cohorts are comparable on GEM handoff ablation (0.588 vs. 0.625, MHA marginally lower), and GQA in fact recovers slightly more under patching. At C=7, the same two cohorts show a much larger ablation gap; that gap does not persist at full concept coverage, so we draw no architecture ranking from ablation magnitude, and a “redundant vs. sparse encoding” dichotomy is not supported by ablation efficacy at C=17. Both cohorts are strongly causally active at the detected CAZ peak, which is the load-bearing methodological point. Two architecture-specific effects do survive at C=17, neither concerning ablation magnitude:
- Gemma-2 (alternating local/global) is the one cohort whose Fisher-peak ablation is markedly weaker (0.367): its functional allocation is recovered at the final global attention layer, where patching recovery is near-complete (Table S3, §F). The weak Fisher-peak ablation is real for this cohort, but §6.9’s deeper investigation shows it is not architecture-specific in the causal sense: gemma-2-27b (trained from scratch, not distilled) and the RLHF’d gemma-2-9b-it are equally affected, every tested architectural component — the attention mechanism itself, softcapping, the RMSNorm sandwich — was ruled out, and the instability only partially eases in the architecturally-different Gemma-4 generation. It is a distributed-encoding, single-direction-readout effect (§6.9), not an attention-architecture one — with the same n=2 caveat as ever: this rests on the same population size at which the C=7 MHA/GQA ablation-gap claim (above) also looked solid before the full C=17 concept set showed otherwise; treat it as a case study pending a larger Gemma cohort. The near-complete recovery at Gemma’s final global layer is likewise not architecture-specific localization: near-readout patching recovery is universal in the corpus. At ≈92% relative depth single-layer recovery is ≈1.0 in every cohort (MHA 1.002, GQA 1.003, Gemma-2 1.004; Gemma vs. MHA Mann-Whitney p = 0.65, vs. GQA p = 0.62; per-layer output), so Gemma recovering there is what every architecture does at that depth. What is distinctive about Gemma is only that its Fisher peak is uninformative (single-direction intervention on a distributed code, §6.9); that its recovery site happens to be near the readout is not.
- Score distribution differs by architecture (score-calibration note below): MHA produces more high-score “spike” CAZes than GQA even though the two ablate comparably — geometric prominence and ablation efficacy are distinct axes.
Ablation efficacy is scale-neutral within a fixed architecture: within Pythia, GEM ablation is flat across a 100× scale range (CV 0.02–0.08) with no monotonic scale trend, consistent with the scale-neutrality of %gentle documented in the score-calibration note below. (A position-encoding control showing Pythia clusters with the MHA families, and a KV-compression/SwiGLU-sparsity mechanism proposed to explain weaker GQA ablation, were built to explain the C=7 ablation gap; since that gap is absent at C=17, neither argument is load-bearing here. Patching recovery is high in both cohorts, 0.672 MHA and 0.770 GQA, with Gemma-2’s final global layer near-complete.)
Because the MHA/GQA ablation gap is a C=7 artifact that does not survive at C=17, the architecture-vs-training-scale question is moot for those two cohorts at full concept coverage: there is no ablation-magnitude difference left to attribute. The architecture-specific effects that do remain — Gemma-2’s final-global-layer localization and the MHA-vs-GQA difference in score distribution (more high-score spikes in MHA; score-calibration note below) — are the appropriate targets for any future mechanistic or training-scale follow-up.
Score calibration and the architectural ordering of major CAZes. The “major CAZ” category (score > 0.5) defined in [Henry, 2026a] is architectural more than scale-dependent. Across the 28 base models, major CAZes (score > 0.5; Table 2) tally to 254 in total at C=17. Absolute per-model counts scale with model depth — a deeper model resolves more CAZ regions overall (see the depth trend below) — so the cleaner cross-architecture measure is the proportion of a cohort’s regions that are major. By that measure GQA is the outlier: only 13.0% of GQA regions are major (mean region score 0.26), versus 30.9% for MHA (0.49), 33.3% for Gemma-2 (0.40), and 15.6% for Mistral’s GQA (0.28). GQA distributes concept assembly across many gentle events rather than concentrating it into a few high-score peaks; the other cohorts concentrate more. By absolute per-model count the averages are MHA 9.8 (range 4–15), Gemma-2 12.5, Mistral 7.0, and GQA 6.6 (range 4–10) — GQA is lower than MHA per model but not near-zero, and Gemma-2’s high count reflects its 42-layer depth (more regions overall) as much as its concentration. Two distinct factors — not parameter scale — track how peak mass is distributed, and they pull in opposite directions.
(i) Architecture. Full attention (MHA) and Gemma-2’s alternating attention — which interleaves global-attention layers — are associated with more concentrated separation, i.e. more high-score peaks; grouped-query attention (GQA) is associated with a flatter, lower-score distribution. A plausible mechanism is that per-layer attention reinforces the concept direction more in MHA/alternating-attention than in GQA architectures, but this reinforcement account is not directly tested here — it is offered as an explanation consistent with the score-distribution pattern, not as an established mechanism. The cohort signature is in the score distribution: MHA regions are 30.9% major / 11.6% gentle (mean score 0.49) and Gemma-2 regions 33.3% major, whereas GQA regions are only 13.0% major / 21.4% gentle (mean score 0.26), with Mistral’s GQA intermediate (15.6% major).
(ii) Depth. Independently, deeper models fragment
each concept into more — and individually gentler — assembly events: the
number of detected CAZ regions per model–concept pair rises with layer
count (per-model Spearman ρ = +0.38, p = 0.009 across the same clean
45-model extended corpus used in §5.3, which excludes a stray
gpt_neo_125m directory also flagged in §6.2), from a mean
of ~2.0 at ≤24 layers to ~3.2 at ≥48 layers. Mean per-region score falls
with model depth in the same direction (per-model ρ = −0.21) but this
secondary correlation is not independently significant at n=45 (p =
0.17) and should be read as directionally consistent rather than as
confirmatory evidence on its own. A deep model has the room to assemble
a concept gradually across many low-amplitude steps rather than
committing in one spike. Within a fixed architecture, scale itself is
roughly neutral — %gentle shows no monotonic scale trend across the
Pythia ladder (0–18% from 70m to 6.9b; Supplementary §B) and the
MHA-only %gentle-vs-parameter-count correlation is ρ ≈ +0.08 (n.s.).
High-score amplification is a reinforcing-attention effect (MHA and
Gemma-2’s global-attention layers), not a small-model artifact —
gentleness is driven jointly by grouped-query attention and by depth.
(We cannot fully separate depth from architecture here — the deep end of
the corpus is GQA-heavy — so the strongest claim the data supports is
the significant regions-per-pair-with-depth trend, not a quantified
depth coefficient.)
The score taxonomy from [Henry, 2026a] remains useful within an architecture family; for cross-family comparison, architectural sparsity and model depth — not parameter scale — are the primary predictors of how peak mass is distributed. The sharpest qualitative break is between architectures that reinforce across layers (MHA and Gemma-2’s globally-attending layers, which concentrate ~31–33% of regions into major CAZes) and grouped-query attention (GQA, including Mistral), which interrupts long-range reinforcement and drops the major-region share to ~13–16%. Mixture-of-experts architectures, where expert routing concentrates computation into parameter subsets, may re-introduce high-score peaks through a different mechanism than MHA amplification; this is untested. Full per-model counts are in Supplementary §B.
8.4 Relationship to Contrastive Direction Methods
The CAZ framework’s extraction methodology — difference-of-means on contrastive pairs, scored by cosine projection — belongs to a rapidly developing lineage in mechanistic interpretability. Burns et al. (2023) established contrastive probing with CCS, finding linear truth directions without supervision. Marks & Tegmark (2024) and Li et al. (2023) independently demonstrated that difference-in-means on contrastive pairs yields causally relevant truth directions. Gurnee & Tegmark (2024) showed that spatial and temporal representations are linearly organized in residual streams of Llama-2, providing an early existence proof of concept-specific linear structure extending beyond linguistic features. Zou et al. (2023) generalised this to multiple concepts simultaneously (Representation Engineering), extracting “reading vectors” for honesty, harmfulness, and power-seeking — the closest methodological ancestor to the CAZ multi-concept approach. Turner et al. (2023) and Panickssery et al. (2024) showed these contrastive vectors can steer model behavior (Activation Addition / Contrastive Activation Addition). Tigges et al. (2024) proved the method for sentiment. Arditi et al. (2024) demonstrated that a single difference-in-means direction mediates refusal across 13 models up to 72B parameters. Park et al. (2024) proposed the Linear Representation Hypothesis as theoretical grounding for why these methods work.
The CAZ framework differs from this lineage in two respects. First, prior work typically extracts directions at a single hand-picked layer or averages across layers; the CAZ framework identifies each concept’s layer of peak geometric separation via layer-wise profiling, and our results show that this optimal layer is concept-specific (e.g., specificity assembles at ~21% depth while exfiltration assembles at ~81%; Table 3). Second, the framework characterises the full assembly process — not just the direction, but when the direction forms (velocity), how cleanly it crystallises (coherence), and how it hands off between sub-representations at different depths. This process view reveals structure (multimodal assembly, encoding strategy differences) that the single-direction extraction approach does not capture.
This paper does not itself run a head-to-head comparison against a single fixed-layer difference-of-means probe — the natural baseline for a paper claiming the CAZ process view adds value over standard extraction. That comparison is the companion GEM paper’s [Henry, 2026b] job, and its finding is not that the handoff layer is a privileged extraction point: no fixed, rotation-blind layer choice reliably recovers a concept’s settled direction, which is why tracking the trajectory — not reading off any one coordinate on it — is necessary at all ([Henry, 2026b] §5.1–§5.6). The handoff layer is one reproducible readout of that tracking, and extraction there empirically outperforms peak-layer extraction — 341/493 concept×model trials (69.2%); model-level Wilcoxon W = 356, N = 29, p = 1.34×10⁻³ — with the margin itself attributable to depth rather than to the handoff boundary being special (§8.7). CAZ’s role in this pipeline is to locate the candidate zone GEM then tracks — the baseline test asked of CAZ alone would only be informative if CAZ were being proposed as a standalone extraction method rather than the assembly-zone-detection step that feeds GEM.
Relationship to lens methods. The layer-by-layer projection in §2 is methodologically adjacent to the logit lens [nostalgebraist 2020] and tuned lens [Belrose et al. 2023], which project intermediate residual-stream activations onto the unembedding matrix (or a per-layer affine probe) to produce depth-indexed prediction trajectories. The framework paper develops this comparison in full [Henry 2026a §2.1]; the relevant point for the present evaluation is that CAZ detection inherits the lens lineage’s commitment to tracking representation change across depth, but projects onto concept-contrast directions obtained from external stimulus pairs rather than onto vocabulary axes. Concepts without canonical lexicalization — credibility, moral valence, certainty — do not project cleanly onto the unembedding and fall outside the natural scope of logit-lens interpretation, which motivates the contrast-direction formulation used here. Tuned Lens could serve as a baseline for the velocity metric in settings where concept and vocabulary are tightly coupled; we do not run that comparison here.
8.5 Cross-Architecture Alignment: Scope and Related Work
The question of whether CAZ-detected concept directions converge across independently trained architectures — the cross-architecture reading of P5 — is pursued in dedicated companion work [Henry, 2026d] and is outside the scope of this validation study; we make no cross-model alignment claim here. It connects to a concurrent line on cross-model alignment: Jha et al. (2025) demonstrate unsupervised translation between output embedding spaces across multiple model backbones, aligning final-layer sentence representations — spaces explicitly trained to be useful — whereas the companion analysis operates on internal residual-stream directions at specific concept peaks, spaces not designed to be aligned. Whether such alignment constitutes evidence for the Platonic Representation Hypothesis [Huh et al., 2024] is a theoretical question that belongs to that companion work, not to this paper.
8.6 Cross-Validation Against Gemma Scope SAEs
We cross-validated Gemma-2-2b’s CAZ structure against the Gemma Scope sparse autoencoders (gemma-scope-2b-pt-res, 16k-width, all 26 layers; Lieberum et al., 2024) — an independent decomposition with no knowledge of our eigenvectors or peak detector. The two methods are convergent on two counts that are not built in (each carrying a caveat stated below): (i) direction agreement — the top differential SAE feature decoder directions align with our concept eigenvectors at CAZ peaks (best positive cosines 0.51–0.84 across all 17 concepts), and (ii) the shared-peak finding — the SAE independently flags layers 11, 15, 17, and 19 as maximally polysemantic (6 concepts peaking at each), the same layers CAZ marks as concurrent assembly events. A per-layer curve correlation (\(r = 0.979\), range 0.949–0.993) confirms both pipelines track the same cumulative signal, but we report it as a consistency check, not independent convergence evidence: both measure unnormalized accumulation that grows monotonically toward the output, so high correlation is expected. Two limits attach and are stated plainly: the shared-peak convergence carries no permutation null (out of scope here), so it is a suggestive post-hoc pattern-match rather than an established convergence; and the direction cosines are measured against gemma-2-2b difference-of-means directions, which are underdetermined point estimates at N=250 (§6.9), so 0.51–0.84 is a lower bound distorted downward by that instability. Full analysis — per-feature alignments, the polysemantic-axis structure (e.g. feature 8529 at L19), the shared-peak cluster semantics, and the curve-equivalence derivation — is in supplementary §G (Figure S2).
8.7 Limitations
Concept selection. The 17 concepts were chosen by the author for definitional clarity and contrastive operationalizability (§2.2); no systematic survey of concept space was conducted and no representativeness is claimed — concepts poorly served by contrastive pairs (no clear antonym, world-knowledge-dependent, culturally contingent) are invisible to this method. The ordering (τ = 0.404) describes these 17; extrapolation is untested.
Concept coverage. The 17 concepts label ~8.6% of persistent spectral features (60/700, §7; an unweighted count, not a variance-weighted fraction); the dark-matter question remains open.
Self-evaluation. All experiments, analysis, and interpretation are by the framework’s author; the same author specified the predictions, ran the tests, and assigned the verdicts, so independent replication would carry more evidential weight (data and code are released to enable it). The one prediction whose evaluation raises a distinct double-exposure concern — P5, where the pre-specified operationalization and the analysis share a single source — is not scored in this paper; it is deferred to dedicated companion work [Henry, 2026d], where that concern is properly the companion’s to disclose.
Scale ceiling. The primary corpus tops out at 12–14B parameters (the §5.3 width–abstraction analysis alone reaches 40–72B); whether the depth-ordering holds at frontier scale (70B+) is untested.
Dataset provenance and pair fidelity. The main study uses the RCP multi-generator consensus corpus (§2.2), addressing single-generator bias by construction. The human-validation first pass finds 66% of pairs clean and 14 of 17 concepts ≥76% valid, with a systematic antonym-vs-absence negative defect (moral_valence categorically weak) that does not affect the aggregate ordering — the full report and its geometric reading are in §2.2/§8.8. §C compares the multi-generator pool against the earlier single-generator set (category ordering preserved).
Dataset scale. Results rest on 250 pairs per concept; a larger set would sharpen CAZ boundary and depth estimates. The §8.6 direction-agreement cosines may be the most sample-size-sensitive quantity; this has not been formally power-analyzed.
Credibility bimodality. The three distinct credibility behaviours (§3.3) may reflect genuine architectural differences or heterogeneous “credibility” pairs that different architectures parse differently; reported as a finding, not explained.
Suppression threshold. The 20% ablation-classification threshold is a researcher degree of freedom: the gentle-vs-peak-distal enrichment ranges ≈1.7× (5%) to ≈20× (50%), with 98% gentle efficacy at the 20% operating point. The qualitative conclusion holds across the range; the 98% is threshold-specific (§H).
Statistical power for ordering. At N = 17 concepts the minimum τ distinguishable from zero (p < 0.05) is ≈0.35; the median 0.404 clears it, and the Wilcoxon test (p = 1.49×10⁻⁸) does not assume normality. The four lowest-τ models are reliable disagreers, not noisy measurements: each reproduces its own ordering across independent pair-halves while agreeing with the grand mean at ≈0 (§E) — so their low τ is not a depth-resolution artifact.
Generator robustness. A leave-one-generator-out test rules out the narrow single-generator concern — mean full-vs-LOO ordering τ = 0.931 (range 0.833–0.993) across 28 models, no generator load-bearing (full analysis §I). It does not address that all 14 generators are themselves transformer LMs; a non-LLM contrastive baseline is open follow-up.
MHA/GQA behavioural split. Moot at C=17 — the cohorts are comparable on ablation magnitude (§6.4, §8.3), leaving only a score-distribution difference, which remains confounded with training era and dataset scale.
Smoothing parameters. The velocity window (k = ⌊L/24⌋) and feature-tracking threshold (cos > 0.5) were not formally optimized; P1’s within/post-CAZ optimal split and the 50.3% divergence rate depend on CAZ boundary definitions and are therefore parameter-sensitive estimates.
CAZ score formula sensitivity. The composite score’s three components could be weighted differently. Across four formulas the region ranking is robust (pairwise Kendall τ > 0.77) and the MHA > GQA major-CAZ ordering holds (gap 11.5–17.9 pp), but the absolute “major” percentage is formula-sensitive (11.5–35.2%; current formula 24.3%) — §8.3 category breakdowns should be read as formula-specific (full comparison §I).
Zone-level ablation (GEM) scope. The GEM handoff
ablations reported here use a 1-layer width for all 17 concepts.
Exfiltration was initially re-run at a 3-layer window (§D); it has since
been re-derived at the standard 1-layer window (n = 249, matching the
other sixteen concepts; public dataset
paper_n250/_p2_exfil_width1/), so the earlier window is no
longer a confound. Swapping the corrected width-1 exfiltration cells
into the handoff-vs-peak comparison flips the classification in 4 of the
26 full-corpus cells (Qwen2.5-0.5B, Qwen2.5-3B and gemma-2-9b move to
peak-better, gemma-2-2b to handoff-better; net −2, i.e. 302/442), and
leaves both the Phase-1 pilot (34/34) and the Gemma subset (§6.9, 15/34)
unchanged — so no §6.5 conclusion depends on the exfiltration
window.
The adaptive width rule (w=3 default, w=1 for near-final handoffs) used in the cascade extension is characterised in [Henry, 2026b] §5.2; width is not otherwise sensitivity-tested here. One structural feature of the handoff set was checked directly: each GEM’s terminal node has its handoff pinned to the final layer, so the handoff target set includes a readout-adjacent ablation in every cell while the peak set does so in only 8.2%. Rerunning the comparison with the terminal node excluded from both target sets (interior handoffs vs. interior peaks, multi-node cells only) leaves the advantage intact — handoff-better at 77.8% (246/316), marginally above the 72.5% full-set rate on the same cells — so the effect is not an artifact of the pinned terminal boundary.
The handoff advantage is, however, a depth effect and not a
settling effect. A handoff is by construction deeper than its
peak (min(L_CAZ_end + 1, N − 1)), and the global-sweep regression (§H)
shows depth drives suppression (+0.06 in the shallowest decile to ≈+0.54
in the deepest); the terminal-node check removes only the
pinned-boundary special case, not depth in general. A site-matched depth
control settles it directly: recomputing the comparison against a
depth-matched non-handoff layer at the same site count over the same
GEMs (public dataset paper_n250/_gem_depth_matched/)
collapses the advantage to chance.
On §6.5’s 28-model multi-node population the depth-matched handoff-better rate is 51.8% (model-level Wilcoxon on per-model median deltas p = 0.779, N = 28); on the 25-model round-3 sub-roster that the terminal-node check above uses (Table 1 minus opt-350m and the two Gemma-2 case-study models) it reads 55.2% (p = 0.791) — both indistinguishable from chance, against the settling-vs-depth-confounded 94.2% / +41.1 pp of the shallow-site comparator on the same 28-model population and against §6.5’s own handoff-vs-peak headline of 304/442 (68.8%). The per-model median is the primary aggregator — per-model means are skewed by 16 degenerate gpt2/gpt2-medium cells (retained separation > 150%) — and the cell-level statistic is pseudoreplicated across a model’s concepts and is not quoted.
The 304/442 handoff-vs-peak rate of §6.5 is unchanged and stands as a descriptive fact, but the reading that the handoff layer holds a uniquely settled product is not established against the depth account: the handoff layer is causally more effective because it is deeper, not because settling confers an advantage beyond depth. This control is shared with the companion GEM paper [Henry, 2026b] §5.5, whose protocol rests on the same comparison — but over a differently-selected 25-model interpretable subset (that paper excludes gpt2, gpt2-medium and the two Gemma-2 models; the round-3 sub-roster here excludes opt-350m and the two Gemma-2 models). The two 25-model sets share 23 models and both total 425 cells, so the identical count should not be read as one population; the per-model figures are not directly comparable across the two papers.
Detector parameters. Beyond the disclosed 0.5%
prominence floor, the scored detector sets region boundaries with two
further fixed parameters — a peak-merge threshold
min_valley_depth_frac = 0.03 and a minimum peak separation
min_peak_distance = 2 (§2.4). Both move the headline counts
(varying the valley-depth threshold swings the multimodal rate
materially; increasing the peak distance lowers the region count), and
neither is swept here. They are researcher degrees of freedom held fixed
at their production values; a sensitivity analysis is dedicated
follow-up.
Detection null model scope. The §4.1 permutation null was run on 5 of 28 models (consistent across all 5); the stronger random-direction null is covered by the §6.1 direction-specificity control (median 606.6×).
Direction-specificity not stratified by score category. The 606.6× random-direction control (§6.1, §H) is run once per (model, concept) pair, at that pair’s dominant CAZ peak — the tallest detected region — not separately at each score category. Gentle CAZes are validated against the peak-distal baseline (Table S5: layer-specificity, i.e. where to ablate) but not specifically against random directions at gentle-scored peaks (direction-specificity, i.e. what to ablate); because “dominant” selects the tallest peak per pair, the random-direction sample structurally skews away from gentle CAZes. That gentle CAZes are equally direction-specific is plausible given the layer-specificity result, but it is untested.
Linearity assumption. All metrics in this paper assume concept information is linearly separable in the residual stream — the Linear Representation Hypothesis [Park et al., 2024; §8.4] that the entire contrastive-direction lineage this method belongs to rests on. Concretely: separation, coherence, and velocity are all computed from projections onto a single estimated direction; a concept encoded nonlinearly (for instance, requiring a curved manifold or an XOR-like combination of features rather than a linear subspace) would be invisible to every probe in this paper — it would not register as a gentle CAZ, a dark-matter feature, or anything else; it would simply go undetected. This is a different failure mode from §6.9’s Gemma-2 case: there, the concept was still linearly decodable (0.89–0.999 held-out probe AUC) but distributed across many directions rather than captured cleanly by any single one — a high-dimensional linear encoding, not a nonlinear one. This paper does not test the nonlinear case directly; the §8.6 Gemma Scope SAE cross-validation is the closest adjacent evidence, but sparse autoencoder features are themselves linear directions in a wider dictionary, not a test of genuine nonlinearity. Whether any of the seventeen concepts have a nonlinear component that our linear metrics simply cannot see is accordingly open.
Multiple comparisons. No formal correction is applied across the 28×17×L grid. The aggregated headline statistics (the 3.59× enrichment, τ = 0.404) are each single pooled tests, but concept-level breakdowns (the 50.3% divergence, per-concept split rates) involve uncorrected implicit testing, and the relay-feature p = 0.001 (§7) survives Bonferroni for its four screening rules but remains subject to two further pre-screen choices — so the relay count is provisional (full derivation §I).
Artifact and version discipline. Several statistics were rebuilt from raw per-model JSON after their original scripts became unrecoverable — case/pair counts matched but the derived statistic did not, indicating an unrecorded definitional choice, not a data error. Where the recomputation settled a value (the §7 labeling criterion; the §6.4 divergence rate, 50.3%) the reported number is the current fully-specified recomputation. Two items did not settle, and we mark them rather than report them as recomputed. (i) The §6.4 divergence magnitude — the mean peak-to-causal-layer gap in percentage points — is definition-sensitive: the recomputed definition yields ≈21.9 pp against the originally reported 41.3 pp, so we report only the direction and the 94.4% rate and withdraw the pp magnitude and its cohort split. (ii) The §6.7 within-CAZ vs. inter-CAZ CKA comparison does not reproduce under any canonical pooling convention and reverses sign between conventions; §6.7 accordingly reports no reliable difference. Scripts are now version-pinned alongside each artifact (§9).
Behavioural validation gap (partially addressed). All §6 causal claims are operationalized in activation geometry. The §6.8 behavioural pilot (28 models × 17 concepts) confirms direction-specific suppression (random-direction ablation ≈ 0 in every cohort; concept-direction suppression positive in 27/28 models) but peak-vs-midpoint advantage is not statistically established at 3 probes/concept (p = 0.69); zone-level behavioural suppression and task-accuracy measurement remain follow-up.
Patching endogeneity (addressed). The recovery metric is endogenous to the calibration set; the held-out check bounds inflation at ≈22 pp (uniform across cohorts), so Table 9 recoveries are calibration-set upper bounds — injection-responsiveness holds on held-out data (§F).
Patching baseline gap. Patching was run only at CAZ peaks; no peak-distal patching baseline was collected, so the “sufficient” characterization is relative to the ablation 3.59× peak-distal baseline, not a patching-specific control.
Single-layer ablation gap. Every ablation reported here is a point test, including GEM’s — GEM’s own handoff ablations use a 1-layer width (above) — so single-layer ablation may understate concept presence where the direction rotates across the assembly window even at GEM’s handoff layer. GEM narrows this gap by ablating at the layer immediately past CAZ’s own zone boundary — where the tracked trajectory shows the direction has settled — rather than at the CAZ peak, but a genuinely zone-level (multi-layer) intervention test remains dedicated follow-up; §6.2’s multi-zone dependency result is the closest existing approximation.
The separation-reduction metric measures effect along an estimated direction, not model-agnostic concept removal. §6.9 provides a controlled demonstration of this limit: on gemma-2-2b, projecting out the single estimated concept direction leaves held-out decodability essentially unchanged (0.948 → 0.95), yet the same models return typical mid-corpus enrichment on the separation-reduction metric (peak-vs-peak-distal 3.19–3.69×). Ablating an estimated direction and re-measuring separation along an estimated direction is therefore not equivalent to establishing that the concept has been removed from the representation; the two coincide only when the single-direction estimate captures the concept, which §6.9 shows can fail. This is a general property of the difference-of-means readout, not a Gemma-specific one: the corpus-wide enrichment (3.59×) and the cohort GEM-ablation means (MHA 0.588 / GQA 0.625 / Gemma 0.367) should be read as separation-reduction along the estimated concept axis — a valid comparative instrument across cohorts — rather than as model-agnostic measures of how much of the concept was removed. Where the estimate is clean the two readings converge (§6.9’s held-out test collapses GPT-2 decodability 0.995 → 0.64); where it is not (Gemma-2) they dissociate. Distinguishing “the concept was not removed” from “the concept was not there to remove” corpus-wide requires the held-out erasure test of §6.9 run on every cohort, which is dedicated follow-up.
KL divergence / collateral damage. CAZ peaks are not privileged low-damage intervention points: KL from the unablated next-token distribution is not lower at peaks than at peak-distal layers, and is higher in GQA and Gemma-2 (p = 0.07, 0.016). Post-CAZ layers are superior on both separation-efficiency and KL (median 47.0 vs 32.2 at the peak and 15.7 pre-CAZ, MHA).
Spectral method limitations. SVD is bounded by the hidden dimension and cannot resolve superposition, so a detected feature may be a macro-cluster a sparse autoencoder would split; eigenvector orthogonality may slice the model’s geometry at artificial angles; and the ~91.4% dark-matter fraction is specific to our input distribution. Our flashlight illuminates one patch of the warehouse; the warehouse is larger than the patch. The flashlight is this paper’s specific instrument, not concept geometry itself — SVD’s hidden-dimension ceiling and its orthogonal eigenvectors are properties of the beam, not the room: a sharper light (a sparse autoencoder, unconstrained by orthogonality) would resolve some of what our beam blurs into one feature, and a wider beam (more concept probes, a broader input distribution) would plausibly light up more of the space — §7 already finds no evidence of a hard ceiling on that count. What we can say with confidence is the size of the patch we did light: 8.6% of persistent features, causally active and direction-specific throughout §6. What we cannot say is the size of the warehouse itself — the ~91.4% left dark is a property of where we chose to point the light, not a measurement of how much unlabeled structure actually exists.
8.8 The Geometry Is Only as Good as the Contrast: Pair Fidelity
Every direction in this paper is extracted from a contrastive pair set, and the direction the method recovers is whatever the pairs make the model separate on — the intended concept only to the extent the pairs isolate that concept’s presence from its absence. This is not a detail. The human fidelity validation of §2.2 shows it is a measurable axis of data quality, and one that every automated check is blind to: a bag-of-words probe classifies the pairs at grand-mean AUC 0.999 and a linear probe separates them perfectly (§2.2), because any clean contrast — an antonym included — is linearly separable. Separability certifies that a contrast exists, not that it is the one intended.
For 14 of the 17 concepts the raters confirm the pairs isolate the intended concept (≥76% valid). For a minority they do not: the negatives are opposite-pole passages rather than concept-absent ones (negative-side failures outnumber positive-side 2.7 : 1), with moral_valence the clear case — its negatives are morally bad rather than morally neutral, and not one of its ten pairs is clean. The instructive point is geometric. Those pairs still produce a stable, causally-active CAZ: the model solidifies a direction, and that direction carries every geometric signature this paper measures — it is simply the wrong axis, tracking moral polarity rather than moral-valence presence. Good pairs and bad pairs both yield geometry; only the pairs that encode the intended contrast yield the intended geometry.
The practical consequence — the caveat that applies wherever the Rosetta Concept Pairs corpus is used, here and in the companion papers [Henry, 2026a; Henry, 2026b; Henry, 2026d] — is that the corpus is high-fidelity for the large majority of concepts but not uniformly so, and per-concept results for the low-fidelity concepts (moral_valence above all) should be read as geometry over the pole contrast rather than over concept presence. We report the full fidelity map (§2.2) rather than regenerate the corpus for this work, because the finding is itself a result: pair construction determines which geometry is recovered; human fidelity validation is the only instrument that distinguishes a wrong-target contrast from the intended one; and the aggregate conclusions — carried by the 14 high-fidelity concepts — are unaffected. Extracting the semantic geometry one intends is downstream of pairs that encode the semantics one means — a prerequisite this study makes explicit rather than assumes.
9. Conclusion
The Concept Allocation Zone framework emerges from systematic evaluation across 28 base transformer models from 8 architecture families and 17 semantic concepts with a mixed but informative scorecard. Three findings are robust: a statistically detectable concept ordering tendency across the base models (median per-model \(\tau = 0.404\); W = 0 (sum-of-positive-ranks = 378 over 27 non-zero models), p = 1.49×10⁻⁸; 27 of 28 models positively correlated with one exactly zero; co-predicted at the shallow end by discriminative-token frequency, §3.2), layer-specific ablation sensitivity of detected CAZ peaks (3.59× greater ablation-measured separation suppression at peaks vs. peak-distal layers, p = \(1.58\times10^{-141}\); on the seven original concepts, 98% of gentle CAZes clear 20% suppression versus 28% of peak-distal layers — a 3.47× enrichment in binary detection rate at the 20% operating threshold, §6.1), and an 82.4%/17.6% independent/forward-dependent split across the 850 CAZ pairs at C=17 where forward dependency is physically testable (backward dependency architecturally excluded, and excluded from the denominator with it — the same data read over all 1,700 directed pairs, half of them independent by construction, gives 91.2%/8.8%; §6.2).
No prediction is confirmed outright. P5 (depth-stratified cross-architecture convergence) is a PRH-scope claim outside this validation’s instruments, evaluated in dedicated companion work [Henry, 2026d, in preparation] rather than scored here (§5.5). One prediction is not testable as stated (P4) and one is not supported (P6), and one is partially supported with a peak-selection limitation (P1). P4 (concept handoffs) was invalidated by multimodal allocation (its single-peak precondition is not met). P6 (lexical vs. compositional identity) failed at p = 0.82. P1’s peak-selection limitation — within-CAZ is the modal optimal class (73.1%), with 21.6% of optima post-CAZ, while CAZ score does not by itself rank the most causally-active region among a concept’s multiple CAZes (§6.4) — sharpened the peak-vs-causal-region distinction (Section 6.4). At the full 17 concepts the MHA and GQA+SwiGLU cohorts are comparable on GEM ablation (0.588 vs. 0.625, MHA marginally lower) — both strongly causally active — so we draw no MHA-vs-GQA ranking; the larger gap seen on the earlier 7-concept subset did not persist. The one architecture-specific signature that survives is Gemma-2’s uniquely weak Fisher-peak ablation (alternating attention, n=2 case study); its concept is instead recovered at the final global attention layer, though that near-readout recovery is not itself distinctive — every cohort recovers near-completely at that relative depth (§8.3), so it is Gemma’s Fisher peak being uninformative, not its recovery site, that is architecture-specific. P4’s failure exposed the multimodal allocation structure that the single-peak framework had obscured. P6’s failure narrows the design space for future tests of the shallow/deep distinction. These causal results are geometric throughout: the behavioral pilot confirms the ablated directions are direction-specific on next-token predictions (27/28 models, random-direction ablation ≈ 0) but does not establish peak advantage over a matched-depth control at its probe count (§6.8).
If this validation has a single throughline, it is this (§6.4, §6.6): no single fixed layer — short of the model’s own final one — reliably captures that causal structure alone, whether for reading a concept off it or for intervening on it. Causal structure is real and reliably locatable, but only as a trajectory tracked across depth, not as a coordinate read off at one chosen point.
Concepts assemble multimodally, with depth-separated sub-representations (shallow vs deep peaks, within-model cos 0.12–0.41). At shallow depths, semantically related concepts share dominant directions before diverging — consistent with either shared computational primitives or incomplete separation (§4.5). At depth, relational concepts merge while epistemic and affective concepts diverge — patterns that hold across 20 same-dimension model pairs with a single exception (sentiment × moral_valence at 18/20; Table S7, §J) (directional consistency only; absolute cosine values are not cited here because the Procrustes alignment is underdetermined at 17 concept directions — see Table S7 caveat in §4.3).
On our calibration input distribution, an estimated ~91.4% of the 700 persistent spectral features remain unlabeled by our seventeen concept probes (8.6% labeled, 60/700, N=250, all 28 models — an unweighted feature count, superposition-blind and distribution-specific per §8.7). This dark matter is not noise — it is geometrically coherent and persistent across layers. A small number of candidate relay features appears in the dark matter pool (§7); the specific count is not cited here because dominant-variance and circularity concerns render it provisional — full methodology and labeling remain open follow-up work. Characterizing this structure is the critical next step.
A natural extension is fitting parametric functions to the per-concept separation curve \(S(\ell)\) — treating each model × concept profile as a parameter vector rather than a raw trace. Deviations from the expected functional form would serve as diagnostics: flagging dataset quality issues, detection artifacts, or anomalous model behavior. Combined with CKA-based layer similarity fingerprints, this would provide a compact, quantitative description of how concept encoding varies across architectures — and a principled basis for targeting ablation interventions at fitted peaks rather than raw velocity extrema.
All data and code are publicly available: the reusable CAZ/GEM
library as rosetta_tools (extraction commit
6fed9e2, library version 1.3.1;
https://github.com/jamesrahenry/Rosetta_Tools; DOI
10.5281/zenodo.20361433), the analysis, figure, and extraction scripts
as Rosetta_Analysis v1.1.0
(https://github.com/jamesrahenry/Rosetta_Analysis; DOI
10.5281/zenodo.21583139), and the umbrella index at
https://github.com/jamesrahenry/Rosetta. Pre-extracted model activations
and per-model analysis outputs are available as the Rosetta Activations
dataset at
https://huggingface.co/datasets/james-ra-henry/Rosetta-Activations (DOI
10.57967/hf/9725; the paper_n250 tree provides per-model
residual-stream activations and CAZ/ablation/patching JSON as a
reproduction base). Replication on additional architecture families,
extended concept sets, or frontier-scale models is invited;
correspondence to jamesrahenry@henrynet.ca.
Reproducing each result. Every table and figure in
this paper reproduces from the public concept-pair corpus, public model
weights, and the
rosetta_tools/Rosetta_Analysis codebases named
above, using the paper_n250 activations as a starting
point. The full script-by-script index — which script generates which
table, figure, or statistic — is in Supplementary §L.
Appendix: Common Definitions
This appendix collects the canonical cross-paper definitions shared by the Rosetta Program’s Concept Allocation Zone (CAZ) framework [Henry, 2026a], Geometric Evolution Maps (GEM) [Henry, 2026b], and CAZ Validation (this paper). It is a compact reference for a reader working from a single paper in isolation — each concept’s full derivation, motivation, and supporting argument live in the paper cited alongside it, not here.
CAZ — Concept Allocation Zone. (Developed fully in [Henry, 2026a] §4; the detector and metrics this paper uses to identify CAZes are described in §2.3–2.4.)
A CAZ is a locator: a coordinate on model depth that brackets where a concept is assembled — not the concept itself, and not a discrete functional module. Operationally, a CAZ is the segment of the residual stream between two saddle points of the separation curve \(S(l)\), around a local separation peak. The detector partitions depth into such segments and scores each; the score grades geometric salience (Major→Gentle) — not causal importance, and not membership.
Three governing rules: (1) No membership threshold — every segment is a CAZ; “strong” vs. “gentle” is score, never a binary cut. (2) Depth-extended, not depth-localized — the segmentation tiles the full depth by construction; in the degenerate limit a single segment can span the entire network. (3) A CAZ does not locate causation — score is geometric salience, not causal importance; the causal work can be displaced from the separation peak and can sit outside the segment entirely.
GEM — Geometric Evolution Map. (Developed fully in [Henry, 2026b] §3; the handoff-layer ablation protocol this paper applies is described in §2.5.)
A GEM is the trajectory record of one concept’s difference-of-means direction across one CAZ segment. The settled direction is its terminal reading, not a co-equal component.
Components: window — the layer span of the CAZ segment; trajectory — the per-layer dominant directions across that span, each estimated independently; settled direction — the trajectory’s reading at the segment’s final layer; handoff layer (\(L_H\)) — \(\min(\text{end}+1, N-1)\), the first layer outside the segment, derived from the segment boundary and never independently detected by a rotation criterion.
Atlas. (Developed fully in [Henry, 2026b] §3.)
A concept’s atlas is the set of its GEMs in a model — one GEM per CAZ segment. An ordinary collection of maps: no transition structure between them is implied. An atlas is a container, not an operational object — it carries no defined rule for combining its GEMs into a single concept-level answer; any concept-level result applies its own aggregation rule, which must be stated wherever such a result is reported.
How they fit together. CAZ locates; GEM charts; the handoff is where a settled direction is first evaluated on activations it was not estimated on, and it sits outside the segment that produced it.
Vocabulary — use these, not the alternatives
| term | means | do not say |
|---|---|---|
| CAZ / segment | a scored saddle-to-saddle segment; the locator | “the zone where the concept lives”; “depth-localized” |
| GEM | one segment’s trajectory record | “the GEM” meaning a whole concept; “assembly event” |
| atlas | the set of a concept’s GEMs in a model | “map” (collides with the M in GEM); “manifold” |
| settled direction | the trajectory’s terminal reading, at segment’s end | “the GEM probe”; “the direction at \(L_H\)” |
| handoff layer | segment.end + 1, derived | “detected where rotation ceases”; “the handoff within the zone” |
| caz_score | geometric salience, graded | “significance”; a membership threshold |
| peak-distal | the comparator layer/region away from a CAZ peak | “non-CAZ” — the tiling is total, so there is no non-CAZ layer in an absolute sense |
Full provenance and the working argument behind these
definitions: DEFINITIONS.md and
papers/shared/CAZ_DEFINITION_OF_RECORD.md /
GEM_DEFINITION.md in the accompanying repository.
Supplementary Materials
Twelve supporting sections (§A–§L) accompany this preprint in the
companion file supplementary.md:
- §A · Technical Notes — float64 metrics, OPT embedding projection handling, Marchenko–Pastur threshold definition.
- §B · Per-Model Behavioral Profiles — CAZ / score / %Gentle / major-CAZ / persistent-feature tables for all 28 base models (regenerated from the corrected N=250 artifacts) plus 9 instruct variants, with per-family commentary and cross-family observations.
- §C · Single-Generator vs. Multi-Generator Corpus Comparison — Peak-depth comparison between the original 100-pair single-generator dataset (Claude Sonnet 4.6) and the ~1,400-pair RCP multi-generator consensus pool (14 generators, 4 AI labs; the run predates the N=250 stratified draw) for Pythia-1.4b, GPT-2-XL, Qwen-2.5-3B, and Llama-3.2-3B; category-level ordering structure is preserved across corpus construction methods, with per-concept depth shifts detailed there.
- §D · Exfiltration Corpus Label Defect and Correction — full provenance of the upstream label-inversion defect in the exfiltration source corpus (discovered post-extraction), its measured impact, and the recorded-draw correction protocol behind the exfiltration results reported in this paper.
- §E · Concept-Ordering Robustness Batteries — split-half reliability, token-frequency partial correlations, and leave-one-family-out controls behind the §3 ordering result.
- §F · Architecture-Conditioned Ablation and Patching — full per-cohort ablation and patching detail, the held-out endogeneity check, the peak-vs-causal divergence breakdown, and the optimum-sharpness table (Table S4) behind §6.4.
- §G · Cross-Validation Against Gemma Scope SAEs — the full SAE alignment, polysemantic-axis structure, and shared-peak analysis behind §8.6 (Figure S2).
- §H · Gentle-CAZ Ablation and Specificity Controls — the direction-specificity null, gentle-CAZ efficacy, and cluster-robust enrichment behind §6.1 (Table S5, Figure S3).
- §I · Limitations — Extended Derivations — multiple-comparison accounting and the extended derivations behind §8.7.
- §J · Multimodal and Depth-Dependent Concept Geometry — the depth-structured concept-pair geometry tables (Tables S6, S7) behind §4.2–§4.3.
- §K · Corpus Construction and Pair Audits — RCP corpus construction, the bag-of-words and lexical-overlap baselines, and the human-rating validation behind §2.2.
- §L · Reproducing Each Result — Full Script Index — repository versions, commit pins, and the full per-result script-to-table/figure index behind §9’s reproducibility statement.
Raw extraction outputs, ablation JSONs, patching JSONs, and the plotting code for every figure in this paper are released at the repository linked above.
Acknowledgments
The author acknowledges the support of TELUS, specifically the Chief AI Office, the AI Accelerator, and the Chief Security Office.
Thanks to Ivey Chiu, Steve Pearson, and Krista Hickey for helpful discussions and guidance.
The author acknowledges computational and academic support from the Vector Institute for Artificial Intelligence.
Claude (Anthropic) was used as an AI research tool throughout this project, including dataset pair generation, code development support, and manuscript drafting.
Human-subjects statement. The pair-fidelity validation (§2.2, §8.8) used paid annotators recruited through CloudResearch Connect and Prolific (31 raters; 660 ratings, 540 analysis-grade after quality exclusions (screening on response time and straight-lining); median session ≈ 29 minutes). Raters judged whether machine-generated text pairs express an intended concept contrast; a content warning was shown for concepts involving fictional security or threat scenarios. No personally identifying information was collected or retained beyond the platforms’ anonymous participant identifiers. The task was low-risk annotation of machine-generated text; it was not reviewed by an institutional ethics board, and no IRB/REB approval or exemption was obtained.
Compute and licenses. GPU-hours and energy for
extraction were not systematically logged. The corpus models carry a mix
of licenses — several (Llama-3.x, Gemma-2, Gemma-4) are released under
non-OSI community licenses with use restrictions — and users should
consult each model’s license; the released artifacts
(rosetta_tools, Rosetta_Analysis, and the
activation dataset) are under their stated open licenses (see §9).
Competing interests. The author is an employee of TELUS Communications Inc.; this research was conducted independently of that role, and the author declares no competing interests arising from it. TELUS and the Vector Institute are acknowledged for their support (see Acknowledgments); neither had any role in the study’s design, data collection, analysis, interpretation, or the decision to publish.
References
Arditi, A., Obeso, O., Syed, A., Paleka, D., Panickssery, N., Gurnee, W., & Nanda, N. (2024). Refusal in language models is mediated by a single direction. NeurIPS 2024. arXiv:2406.11717. [Difference-in-means between harmful/harmless prompts isolates a single refusal direction; erasing it disables refusal across 13 models up to 72B.]
Basu, S., Patel, S. Y., Sheth, P., Muralidharan, B., Elamaran, N., Kinra, A., Morgan, J., & Batniji, R. (2026). Interpretability without actionability: mechanistic methods cannot correct language model errors despite near-perfect internal representations. arXiv preprint arXiv:2603.18353.
Belinkov, Y. (2022). Probing classifiers: Promises, shortcomings, and advances. Computational Linguistics, 48(1), 207–219.
Belrose, N., Furman, Z., Smith, L., Halawi, D., Ostrovsky, I., McKinney, L., Biderman, S., & Steinhardt, J. (2023). Eliciting latent predictions from transformers with the tuned lens. arXiv preprint arXiv:2303.08112. [Per-layer affine probe that projects intermediate residual-stream activations onto vocabulary; depth-indexed prediction trajectory as a calibrated successor to the logit lens.]
Biderman, S., Schoelkopf, H., Anthony, Q., Bradley, H., O’Brien, K., Hallahan, E., Khan, M. A., Purohit, S., Prashanth, U. S., Raff, E., Skowron, A., Sutawika, L., & van der Wal, O. (2023). Pythia: A suite for analyzing large language models across training and scaling. ICML 2023. arXiv:2304.01373.
Burns, C., Ye, H., Klein, D., & Steinhardt, J. (2023). Discovering latent knowledge in language models without supervision. ICLR 2023. arXiv:2212.03827. [Foundational contrastive probing: CCS finds linear projections of hidden states satisfying consistency constraints on statement/negation pairs.]
Chan, L., Garriga-Alonso, A., Goldowsky-Dill, N., Greenblatt, R., Nitishinskaya, J., Radhakrishnan, A., Shlegeris, B., & Thomas, N. (2022). Causal scrubbing: A method for rigorously testing interpretability hypotheses. AI Alignment Forum / Redwood Research. [Formal discipline for validating mechanistic hypotheses via recursive activation resampling.]
Fisher, R. A. (1936). The use of multiple measurements in taxonomic problems. Annals of Eugenics, 7(2), 179–188. [Introduced the Fisher criterion for class separability; basis for Fisher-normalized separation metric used throughout this work.]
Geiger, A., Lu, H., Icard, T., & Potts, C. (2021). Causal abstractions of neural networks. NeurIPS 2021. arXiv:2106.02997. [Interchange intervention framework for testing causal alignment between neural network internals and symbolic causal models.]
Gemma Team. (2024). Gemma 2: Improving open language models at a practical size. arXiv:2408.00118.
Goldowsky-Dill, N., MacLeod, C., Sato, L., & Arora, A. (2023). Localizing model behavior with path patching. arXiv preprint arXiv:2304.05969. [Path patching extends activation patching to circuit-level attribution, isolating individual computational paths rather than whole-layer effects.]
Gurnee, W. & Tegmark, M. (2024). Language models represent space and time. ICLR 2024. arXiv:2310.02207. [Linear probes on residual streams decode real-world coordinates; identifies individual space/time neurons in Llama-2.]
Habernal, I. & Gurevych, I. (2017). Argumentation mining in user-generated web discourse. Computational Linguistics, 43(1), 125–179. [Argument-component identification and argument quality in user-generated web discourse; grounds credibility indirectly, as the discourse-quality context in which it is judged — the paper itself brackets author credibility as an open problem rather than benchmarking it.]
Haidt, J. & Joseph, C. (2004). Intuitive ethics: How innately prepared intuitions generate culturally variable virtues. Daedalus, 133(4), 55–66. [Foundation of Moral Foundations Theory; defines the moral valence dimensions including care/harm, fairness/cheating, loyalty/betrayal.]
Henry, J. (2026, software). rosetta_tools: Shared tooling for the Rosetta interpretability research program (version 1.3.1; extraction commit 6fed9e2). Zenodo. https://doi.org/10.5281/zenodo.20361433
Henry, J. (2026, software). Rosetta_Analysis: Analysis, figure, and reproduction scripts for the Rosetta interpretability research program (v1.1.0). Zenodo. https://doi.org/10.5281/zenodo.21583139
Henry, J. (2026, dataset). Rosetta Activations: Pre-extracted transformer residual stream activations for 33 language models across 17 concepts. HuggingFace. https://huggingface.co/datasets/james-ra-henry/Rosetta-Activations (DOI: https://doi.org/10.57967/hf/9725)
Henry, J. (2026, pre-registration). Concept Allocation Zone: predictions P1–P7, pre-specified 2026-04-05, prior to this validation pipeline. waypoint.henrynet.ca/research/concept-assembly-zone/CAZ_Framework.pdf
Henry, J. (2026a). The Concept Allocation Zone: Tracking How Concepts Form Across Transformer Depth. arXiv preprint arXiv:2605.24856.
Henry, J. (2026b). Geometric Evolution Maps: Extracting Stable Concept Probes from Transformer Residual Streams. arXiv preprint arXiv:2605.25848.
Henry, J. (2026d). Concept-Selective Convergence. Manuscript in preparation.
Huh, M., et al. (2024). Position: The platonic representation hypothesis. ICML 2024.
Javaheripi, M., Bubeck, S., Abdin, M., Aneja, J., Mendes, C. C. T., Del Giorno, A., … & Zhao, Y. (2023). Phi-2: The surprising power of small language models. Microsoft Research Blog. [Phi-2 architecture and synthetic textbook training methodology.]
Jha, R., Zhang, C., Shmatikov, V., & Morris, J. X. (2025). Harnessing the universal geometry of embeddings. arXiv:2505.12540. [Unsupervised translation between output embedding spaces; achieves cosine similarity up to 0.92 without paired data. Cited in §8.5 as related work to the companion paper’s internal residual-stream alignment analysis [Henry, 2026d].]
Jiang, A. Q., Sablayrolles, A., Mensch, A., Bamford, C., Chaplot, D. S., de las Casas, D., Bressand, F., Lengyel, G., Lample, G., Saulnier, L., Lavaud, L. R., Lachaux, M.-A., Stock, P., Le Scao, T., Lavril, T., Wang, T., Lacroix, T., & El Sayed, W. (2023). Mistral 7B. arXiv:2310.06825.
Kornblith, S., Norouzi, M., Lee, H., & Hinton, G. (2019). Similarity of neural network representations revisited. In Proceedings of the 36th International Conference on Machine Learning (ICML 2019), PMLR 97, 3519–3529.
Li, K., Patel, O., Viégas, F., Pfister, H., & Wattenberg, M. (2023). Inference-time intervention: Eliciting truthful answers from a language model. NeurIPS 2023 (spotlight). arXiv:2306.03341. [Linear probes on contrastive TruthfulQA pairs identify truthful directions; shifting activations at inference improves truthfulness.]
Lieberum, T., Rajamanoharan, S., Conmy, A., Smith, L., Sonnerat, N., Varma, V., Kramár, J., Dragan, A., Shah, R., & Nanda, N. (2024). Gemma Scope: Open sparse autoencoders everywhere all at once on Gemma 2. arXiv preprint arXiv:2408.05147. [Comprehensive SAE release for Gemma 2; residual stream SAEs at all layers used for cross-validation of CAZ structure in §8.6.]
Marchenko, V. A. & Pastur, L. A. (1967). Distribution of eigenvalues for some sets of random matrices. Mathematics of the USSR-Sbornik, 1(4), 457–483. [Marchenko-Pastur law; defines the theoretical upper bound \(\lambda_+\) for eigenvalues produced by a random matrix, used here to threshold structured from unstructured activation features.]
Marks, S. & Tegmark, M. (2024). The geometry of truth: Emergent linear structure in large language model representations of true/false datasets. COLM 2024 (spotlight). arXiv:2310.06824. [Contrastive true/false pairs yield truth directions via difference-in-means; causally validated via activation patching.]
Meng, K., Bau, D., Andonian, A., & Belinkov, Y. (2022). Locating and editing factual associations in GPT. NeurIPS 2022. arXiv:2202.05262. [Causal tracing via activation patching; establishes the methodology of injecting activations from one forward pass into another to identify causal contributors to model predictions.]
Meta. (2024). The Llama 3 herd of models. arXiv:2407.21783.
Mirza, P. & Tonelli, S. (2016). CATENA: Causal and temporal relation extraction from natural language. COLING 2016. [Grounding for causation and temporal ordering as tractable NLP concepts with well-defined annotation schemes.]
Morante, R. & Blanco, E. (2012). *SEM 2012 shared task: Resolving the scope and focus of negation. Proceedings of the First Joint Conference on Lexical and Computational Semantics, pages 265–274. [Negation scope as a formally defined and benchmarked NLP problem.]
nostalgebraist. (2020). Interpreting GPT: the logit lens. LessWrong / AI Alignment Forum, August 2020. [Projection of intermediate residual-stream activations through the unembedding matrix to read layer-by-layer prediction trajectories; methodological antecedent of depth-indexed interpretability.]
Panickssery, N., Gabrieli, N., Schulz, J., Tong, M., Hubinger, E., & Turner, A. M. (2024). Steering Llama 2 via contrastive activation addition. ACL 2024 (Outstanding Paper). arXiv:2312.06681. [Systematic contrastive activation addition across behavioral dimensions; averages DoM vectors from matched contrastive pairs.]
Park, K., Choe, Y. J., & Veitch, V. (2024). The linear representation hypothesis and the geometry of large language models. ICML 2024. arXiv:2311.03658. [Theoretical formalization of linear representations; causal inner product connecting probing and steering.]
Pearl, J. (2000). Causality: Models, Reasoning, and Inference. Cambridge University Press. [Formal intervention-based framework for causal identification; the §6 scope note adopts its definition — an intervention at a specific layer producing a measurable downstream effect.]
Pustejovsky, J., Castaño, J., Ingria, R., Saurí, R., Gaizauskas, R., Setzer, A., & Katz, G. (2003). TimeML: Robust specification of event and temporal expressions in text. In New Directions in Question Answering (AAAI Spring Symposium). [Standardized annotation scheme for events and temporal relations; established temporal ordering as a benchmarked NLP task.]
Qwen Team. (2024). Qwen2.5 technical report. arXiv:2412.15115.
Radford, A., Wu, J., Child, R., Luan, D., Amodei, D., & Sutskever, I. (2019). Language models are unsupervised multitask learners. OpenAI technical report.
Socher, R., Perelygin, A., Wu, J., Chuang, J., Manning, C. D., Ng, A., & Potts, C. (2013). Recursive deep models for semantic compositionality over a sentiment treebank. EMNLP 2013. [Stanford Sentiment Treebank (SST); established fine-grained sentiment as a benchmarked NLP task.]
Szarvas, G., Vincze, V., Farkas, R., Móra, G., & Gurevych, I. (2012). Cross-genre and cross-domain detection of semantic uncertainty. Computational Linguistics, 38(2), 335–367. [Grounding for certainty/epistemic modality as a formally defined NLP task; defines the annotation schema for uncertainty and hedging used across domains.]
Tenney, I., Das, D., & Pavlick, E. (2019). BERT rediscovers the classical NLP pipeline. In Proceedings of the 57th Annual Meeting of the Association for Computational Linguistics (ACL 2019), 4593–4601. arXiv:1905.05950. [Edge-probing across BERT’s layers locates where syntactic vs. semantic tasks become decodable (center-of-gravity of probe performance by depth); a probing study, run without causal interventions.]
Tigges, C., Hollinsworth, O. J., Geiger, A., & Nanda, N. (2024). Linear representations of sentiment in large language models. BlackboxNLP 2024 / ICML 2024 MI Workshop (spotlight). arXiv:2310.15154. [DoM on contrastive sentiment activations extracts a single causally relevant sentiment direction.]
Turner, A. M., Thiergart, L., Leech, G., Udell, D., Vazquez, J. J., Mini, U., & MacDiarmid, M. (2023). Steering language models with activation engineering. arXiv:2308.10248. [Contrastive activation vectors from minimal prompt pairs steer model behavior at inference time.]
UzZaman, N., Llorens, H., Derczynski, L., Allen, J., Verhagen, M., & Pustejovsky, J. (2013). SemEval-2013 Task 1: TempEval-3: Evaluating time expressions, events, and temporal relations. Proceedings of SemEval 2013, pages 1–9. [TempEval shared task; grounding for temporal ordering as a benchmarked NLP concept.]
Vig, J., Gehrmann, S., Belinkov, Y., Qian, S., Nevo, D., Sakenis, S., Huang, J., Singer, Y., & Shieber, S. (2020). Causal mediation analysis for interpreting neural NLP: The case of gender bias. NeurIPS 2020. arXiv:2004.12265. [Canonical activation-patching setup: injecting activations from a counterfactual forward pass to measure causal contribution of specific layers/components.]
Wang, K., Variengien, A., Conmy, A., Shlegeris, B., & Steinhardt, J. (2023). Interpretability in the wild: A circuit for indirect object identification in GPT-2 small. ICLR 2023. arXiv:2211.00593. [Activation patching applied to full circuit discovery; reference instance of the patching-as-validation methodology.]
Zhang, S., Roller, S., Goyal, N., Artetxe, M., Chen, M., Chen, S., … & Zettlemoyer, L. (2022). OPT: Open pre-trained transformer language models. arXiv:2205.01068.
Zou, A., Phan, L., Chen, S., Campbell, J., Guo, P., Ren, R., … & Hendrycks, D. (2023). Representation engineering: A top-down approach to AI transparency. arXiv preprint arXiv:2310.01405. [Multi-concept contrastive “reading vectors” for honesty, harmfulness, and power-seeking; closest methodological ancestor to the CAZ multi-concept approach (§8.4).]